British West Indian vs Romanian 4 or more Vehicles in Household
COMPARE
British West Indian
Romanian
4 or more Vehicles in Household
4 or more Vehicles in Household Comparison
British West Indians
Romanians
3.5%
4 OR MORE VEHICLES IN HOUSEHOLD
0.0/ 100
METRIC RATING
343rd/ 347
METRIC RANK
6.2%
4 OR MORE VEHICLES IN HOUSEHOLD
30.7/ 100
METRIC RATING
192nd/ 347
METRIC RANK
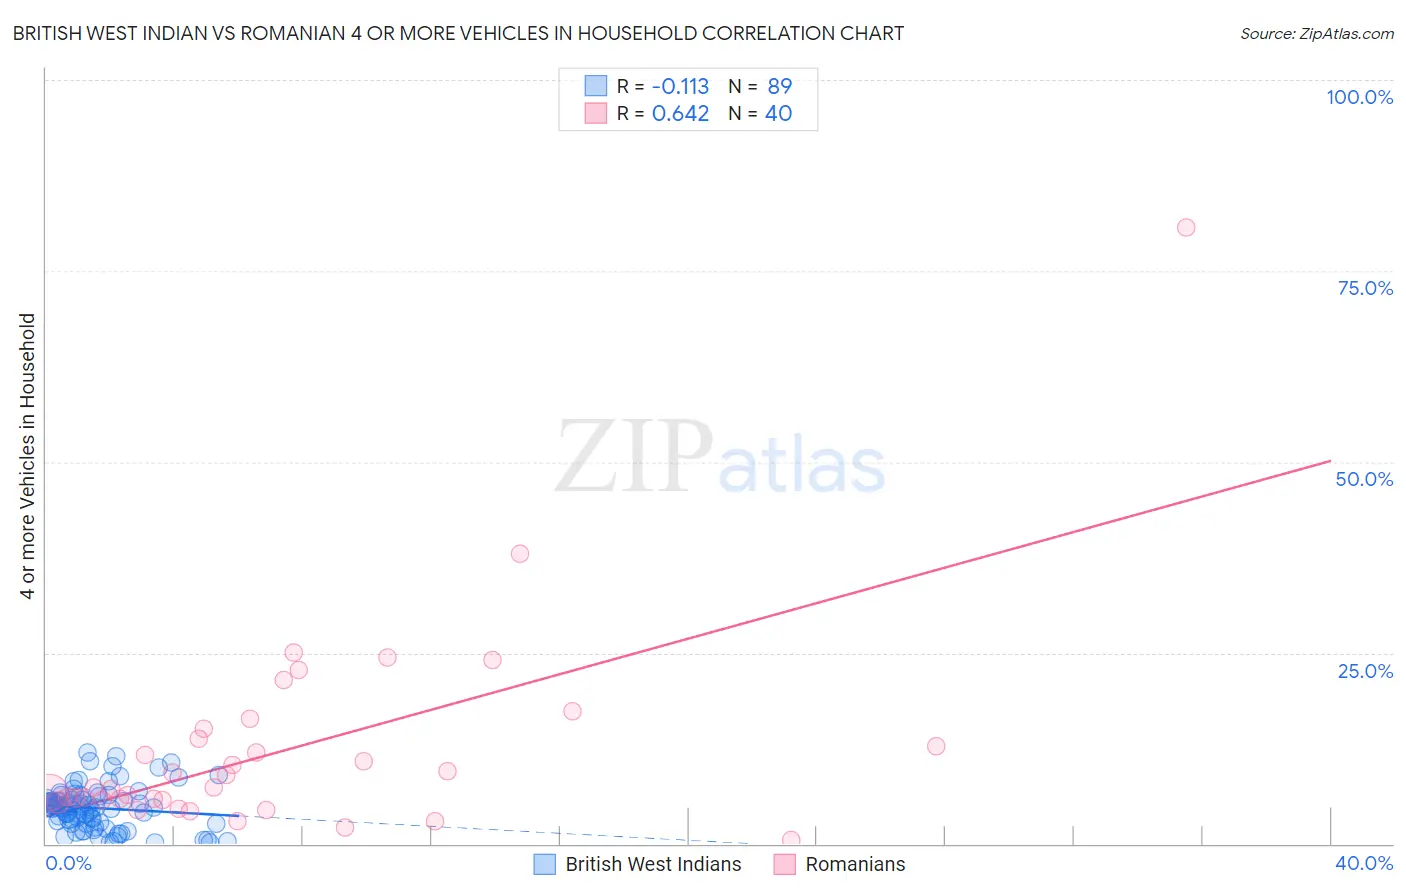
British West Indian vs Romanian 4 or more Vehicles in Household Correlation Chart
The statistical analysis conducted on geographies consisting of 151,775,264 people shows a poor negative correlation between the proportion of British West Indians and percentage of households with 4 or more vehicles available in the United States with a correlation coefficient (R) of -0.113 and weighted average of 3.5%. Similarly, the statistical analysis conducted on geographies consisting of 376,299,179 people shows a significant positive correlation between the proportion of Romanians and percentage of households with 4 or more vehicles available in the United States with a correlation coefficient (R) of 0.642 and weighted average of 6.2%, a difference of 79.4%.
4 or more Vehicles in Household Correlation Summary
| Measurement | British West Indian | Romanian |
| Minimum | 0.11% | 0.45% |
| Maximum | 11.9% | 80.8% |
| Range | 11.8% | 80.3% |
| Mean | 4.7% | 12.3% |
| Median | 4.8% | 7.4% |
| Interquartile 25% (IQ1) | 2.7% | 5.8% |
| Interquartile 75% (IQ3) | 5.7% | 14.4% |
| Interquartile Range (IQR) | 3.0% | 8.6% |
| Standard Deviation (Sample) | 2.7% | 13.6% |
| Standard Deviation (Population) | 2.7% | 13.4% |
Similar Demographics by 4 or more Vehicles in Household
Demographics Similar to British West Indians by 4 or more Vehicles in Household
In terms of 4 or more vehicles in household, the demographic groups most similar to British West Indians are Guyanese (3.5%, a difference of 0.94%), Immigrants from Guyana (3.4%, a difference of 1.6%), Dominican (3.5%, a difference of 1.6%), Immigrants from Barbados (3.6%, a difference of 4.5%), and Immigrants from Uzbekistan (3.6%, a difference of 5.0%).
| Demographics | Rating | Rank | 4 or more Vehicles in Household |
| Immigrants | Albania | 0.0 /100 | #333 | Tragic 4.1% |
| Immigrants | Trinidad and Tobago | 0.0 /100 | #334 | Tragic 4.1% |
| Barbadians | 0.0 /100 | #335 | Tragic 3.9% |
| Immigrants | Bangladesh | 0.0 /100 | #336 | Tragic 3.9% |
| Vietnamese | 0.0 /100 | #337 | Tragic 3.9% |
| Immigrants | Cabo Verde | 0.0 /100 | #338 | Tragic 3.8% |
| Immigrants | Uzbekistan | 0.0 /100 | #339 | Tragic 3.6% |
| Immigrants | Barbados | 0.0 /100 | #340 | Tragic 3.6% |
| Dominicans | 0.0 /100 | #341 | Tragic 3.5% |
| Guyanese | 0.0 /100 | #342 | Tragic 3.5% |
| British West Indians | 0.0 /100 | #343 | Tragic 3.5% |
| Immigrants | Guyana | 0.0 /100 | #344 | Tragic 3.4% |
| Immigrants | Dominican Republic | 0.0 /100 | #345 | Tragic 3.3% |
| Immigrants | St. Vincent and the Grenadines | 0.0 /100 | #346 | Tragic 3.0% |
| Immigrants | Grenada | 0.0 /100 | #347 | Tragic 2.7% |
Demographics Similar to Romanians by 4 or more Vehicles in Household
In terms of 4 or more vehicles in household, the demographic groups most similar to Romanians are Inupiat (6.2%, a difference of 0.010%), South African (6.2%, a difference of 0.19%), Immigrants from Eastern Asia (6.2%, a difference of 0.31%), Immigrants from Kuwait (6.2%, a difference of 0.34%), and Immigrants from Sweden (6.2%, a difference of 0.47%).
| Demographics | Rating | Rank | 4 or more Vehicles in Household |
| Thais | 36.9 /100 | #185 | Fair 6.2% |
| Immigrants | Northern Europe | 36.8 /100 | #186 | Fair 6.2% |
| Immigrants | South Africa | 35.4 /100 | #187 | Fair 6.2% |
| Kiowa | 34.7 /100 | #188 | Fair 6.2% |
| Immigrants | Eastern Asia | 33.3 /100 | #189 | Fair 6.2% |
| South Africans | 32.2 /100 | #190 | Fair 6.2% |
| Inupiat | 30.7 /100 | #191 | Fair 6.2% |
| Romanians | 30.7 /100 | #192 | Fair 6.2% |
| Immigrants | Kuwait | 28.0 /100 | #193 | Fair 6.2% |
| Immigrants | Sweden | 27.0 /100 | #194 | Fair 6.2% |
| Argentineans | 27.0 /100 | #195 | Fair 6.2% |
| Tsimshian | 26.4 /100 | #196 | Fair 6.2% |
| Immigrants | Sri Lanka | 23.7 /100 | #197 | Fair 6.1% |
| Immigrants | Portugal | 22.3 /100 | #198 | Fair 6.1% |
| Immigrants | Norway | 21.8 /100 | #199 | Fair 6.1% |