Puget Sound Salish vs Romanian 4 or more Vehicles in Household
COMPARE
Puget Sound Salish
Romanian
4 or more Vehicles in Household
4 or more Vehicles in Household Comparison
Puget Sound Salish
Romanians
9.4%
4 OR MORE VEHICLES IN HOUSEHOLD
100.0/ 100
METRIC RATING
6th/ 347
METRIC RANK
6.2%
4 OR MORE VEHICLES IN HOUSEHOLD
30.7/ 100
METRIC RATING
192nd/ 347
METRIC RANK
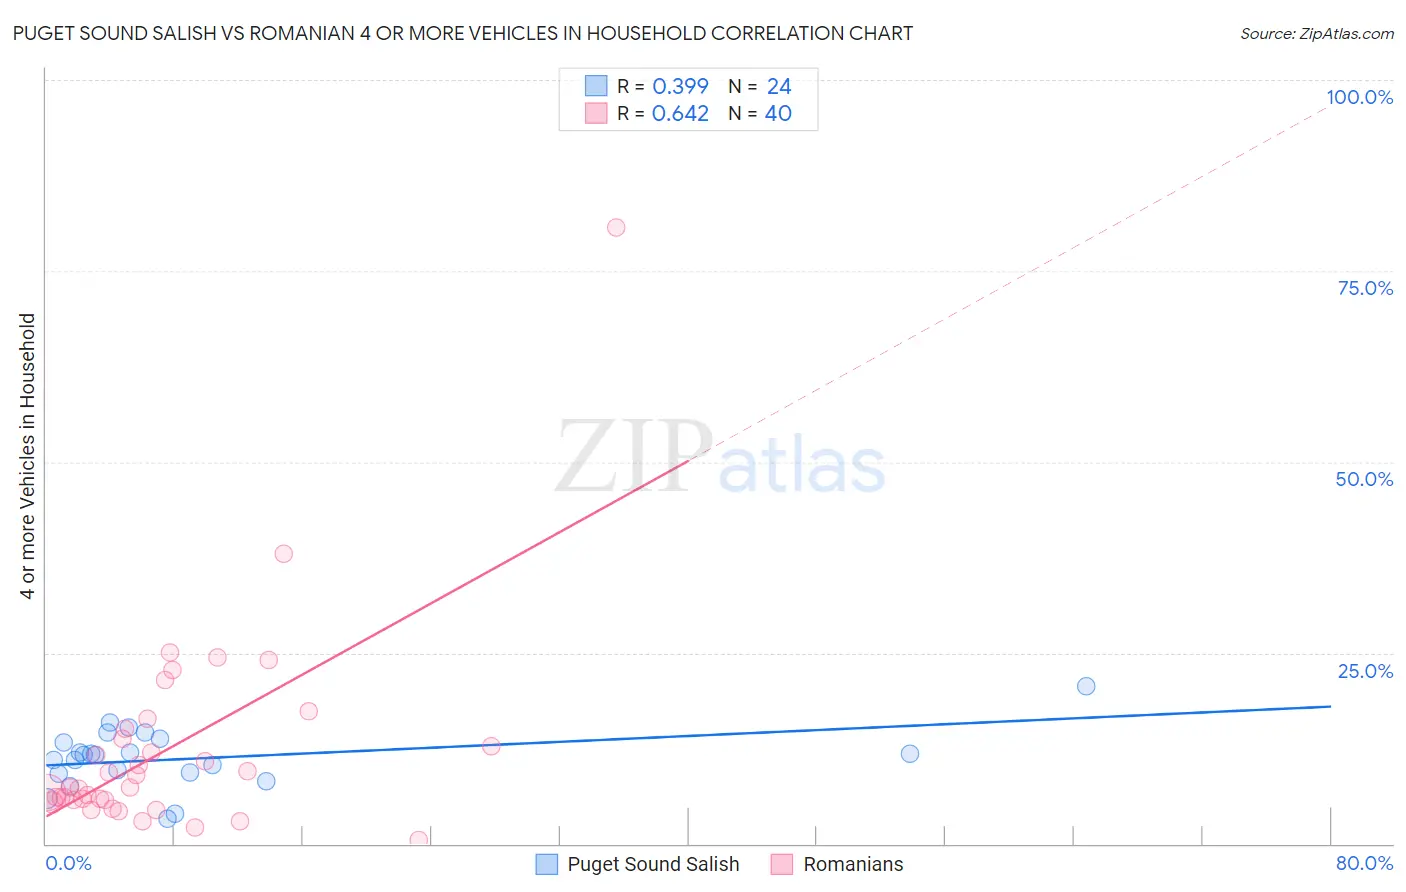
Puget Sound Salish vs Romanian 4 or more Vehicles in Household Correlation Chart
The statistical analysis conducted on geographies consisting of 46,139,594 people shows a mild positive correlation between the proportion of Puget Sound Salish and percentage of households with 4 or more vehicles available in the United States with a correlation coefficient (R) of 0.399 and weighted average of 9.4%. Similarly, the statistical analysis conducted on geographies consisting of 376,299,179 people shows a significant positive correlation between the proportion of Romanians and percentage of households with 4 or more vehicles available in the United States with a correlation coefficient (R) of 0.642 and weighted average of 6.2%, a difference of 51.6%.
4 or more Vehicles in Household Correlation Summary
| Measurement | Puget Sound Salish | Romanian |
| Minimum | 3.3% | 0.45% |
| Maximum | 20.6% | 80.8% |
| Range | 17.4% | 80.3% |
| Mean | 11.1% | 12.3% |
| Median | 11.6% | 7.4% |
| Interquartile 25% (IQ1) | 9.3% | 5.8% |
| Interquartile 75% (IQ3) | 13.5% | 14.4% |
| Interquartile Range (IQR) | 4.2% | 8.6% |
| Standard Deviation (Sample) | 3.8% | 13.6% |
| Standard Deviation (Population) | 3.8% | 13.4% |
Similar Demographics by 4 or more Vehicles in Household
Demographics Similar to Puget Sound Salish by 4 or more Vehicles in Household
In terms of 4 or more vehicles in household, the demographic groups most similar to Puget Sound Salish are Native Hawaiian (9.4%, a difference of 0.020%), Arapaho (9.4%, a difference of 0.41%), Samoan (9.2%, a difference of 1.8%), Immigrants from Fiji (9.6%, a difference of 2.5%), and Paiute (9.0%, a difference of 4.2%).
| Demographics | Rating | Rank | 4 or more Vehicles in Household |
| Yakama | 100 /100 | #1 | Exceptional 12.9% |
| Colville | 100.0 /100 | #2 | Exceptional 11.1% |
| Spanish American Indians | 100.0 /100 | #3 | Exceptional 10.8% |
| Tongans | 100.0 /100 | #4 | Exceptional 10.0% |
| Immigrants | Fiji | 100.0 /100 | #5 | Exceptional 9.6% |
| Puget Sound Salish | 100.0 /100 | #6 | Exceptional 9.4% |
| Native Hawaiians | 100.0 /100 | #7 | Exceptional 9.4% |
| Arapaho | 100.0 /100 | #8 | Exceptional 9.4% |
| Samoans | 100.0 /100 | #9 | Exceptional 9.2% |
| Paiute | 100.0 /100 | #10 | Exceptional 9.0% |
| Immigrants | Mexico | 100.0 /100 | #11 | Exceptional 9.0% |
| Mexicans | 100.0 /100 | #12 | Exceptional 8.9% |
| Hawaiians | 100.0 /100 | #13 | Exceptional 8.9% |
| Chinese | 100.0 /100 | #14 | Exceptional 8.8% |
| Shoshone | 100.0 /100 | #15 | Exceptional 8.8% |
Demographics Similar to Romanians by 4 or more Vehicles in Household
In terms of 4 or more vehicles in household, the demographic groups most similar to Romanians are Inupiat (6.2%, a difference of 0.010%), South African (6.2%, a difference of 0.19%), Immigrants from Eastern Asia (6.2%, a difference of 0.31%), Immigrants from Kuwait (6.2%, a difference of 0.34%), and Immigrants from Sweden (6.2%, a difference of 0.47%).
| Demographics | Rating | Rank | 4 or more Vehicles in Household |
| Thais | 36.9 /100 | #185 | Fair 6.2% |
| Immigrants | Northern Europe | 36.8 /100 | #186 | Fair 6.2% |
| Immigrants | South Africa | 35.4 /100 | #187 | Fair 6.2% |
| Kiowa | 34.7 /100 | #188 | Fair 6.2% |
| Immigrants | Eastern Asia | 33.3 /100 | #189 | Fair 6.2% |
| South Africans | 32.2 /100 | #190 | Fair 6.2% |
| Inupiat | 30.7 /100 | #191 | Fair 6.2% |
| Romanians | 30.7 /100 | #192 | Fair 6.2% |
| Immigrants | Kuwait | 28.0 /100 | #193 | Fair 6.2% |
| Immigrants | Sweden | 27.0 /100 | #194 | Fair 6.2% |
| Argentineans | 27.0 /100 | #195 | Fair 6.2% |
| Tsimshian | 26.4 /100 | #196 | Fair 6.2% |
| Immigrants | Sri Lanka | 23.7 /100 | #197 | Fair 6.1% |
| Immigrants | Portugal | 22.3 /100 | #198 | Fair 6.1% |
| Immigrants | Norway | 21.8 /100 | #199 | Fair 6.1% |