Immigrants from Oceania vs Romanian Married-couple Households
COMPARE
Immigrants from Oceania
Romanian
Married-couple Households
Married-couple Households Comparison
Immigrants from Oceania
Romanians
46.9%
MARRIED-COUPLE HOUSEHOLDS
74.8/ 100
METRIC RATING
157th/ 347
METRIC RANK
48.4%
MARRIED-COUPLE HOUSEHOLDS
98.9/ 100
METRIC RATING
67th/ 347
METRIC RANK
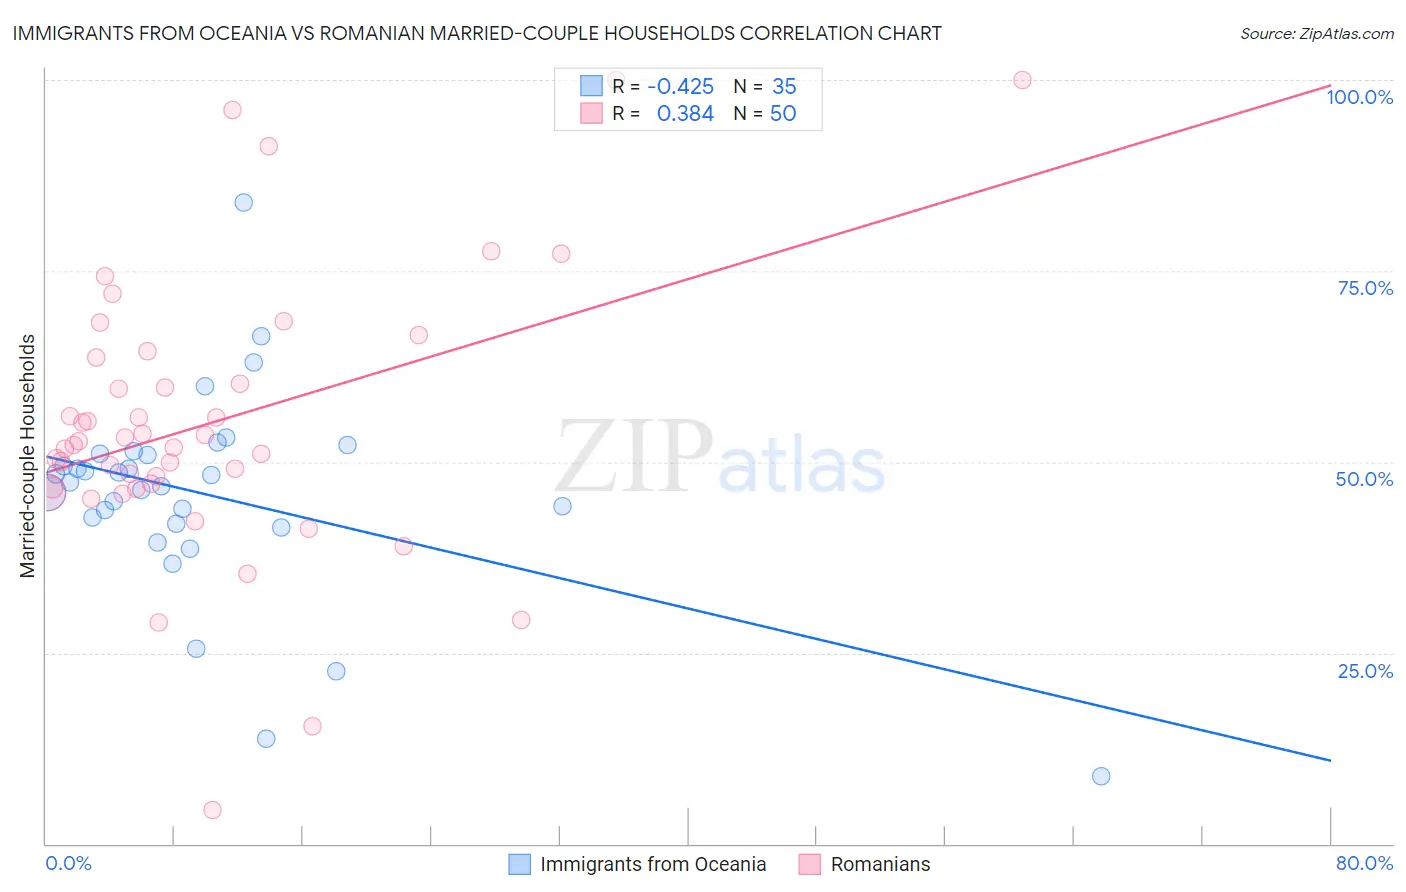
Immigrants from Oceania vs Romanian Married-couple Households Correlation Chart
The statistical analysis conducted on geographies consisting of 305,387,032 people shows a moderate negative correlation between the proportion of Immigrants from Oceania and percentage of married-couple family households in the United States with a correlation coefficient (R) of -0.425 and weighted average of 46.9%. Similarly, the statistical analysis conducted on geographies consisting of 377,697,282 people shows a mild positive correlation between the proportion of Romanians and percentage of married-couple family households in the United States with a correlation coefficient (R) of 0.384 and weighted average of 48.4%, a difference of 3.2%.
Married-couple Households Correlation Summary
| Measurement | Immigrants from Oceania | Romanian |
| Minimum | 8.8% | 4.5% |
| Maximum | 84.0% | 100.0% |
| Range | 75.2% | 95.5% |
| Mean | 45.7% | 55.1% |
| Median | 47.2% | 52.5% |
| Interquartile 25% (IQ1) | 41.9% | 46.7% |
| Interquartile 75% (IQ3) | 51.1% | 63.6% |
| Interquartile Range (IQR) | 9.2% | 17.0% |
| Standard Deviation (Sample) | 13.6% | 18.4% |
| Standard Deviation (Population) | 13.4% | 18.3% |
Similar Demographics by Married-couple Households
Demographics Similar to Immigrants from Oceania by Married-couple Households
In terms of married-couple households, the demographic groups most similar to Immigrants from Oceania are Armenian (46.9%, a difference of 0.030%), Immigrants from Western Asia (46.9%, a difference of 0.060%), Arab (46.9%, a difference of 0.060%), Hmong (47.0%, a difference of 0.070%), and Serbian (47.0%, a difference of 0.080%).
| Demographics | Rating | Rank | Married-couple Households |
| Immigrants | Russia | 77.6 /100 | #150 | Good 47.0% |
| Immigrants | Bulgaria | 76.8 /100 | #151 | Good 47.0% |
| Serbians | 76.3 /100 | #152 | Good 47.0% |
| Hmong | 76.2 /100 | #153 | Good 47.0% |
| Immigrants | Western Asia | 76.1 /100 | #154 | Good 46.9% |
| Arabs | 76.0 /100 | #155 | Good 46.9% |
| Armenians | 75.4 /100 | #156 | Good 46.9% |
| Immigrants | Oceania | 74.8 /100 | #157 | Good 46.9% |
| Immigrants | Nonimmigrants | 73.3 /100 | #158 | Good 46.9% |
| Osage | 73.2 /100 | #159 | Good 46.9% |
| Iraqis | 71.7 /100 | #160 | Good 46.9% |
| Delaware | 71.2 /100 | #161 | Good 46.8% |
| Colombians | 71.0 /100 | #162 | Good 46.8% |
| Immigrants | Turkey | 70.2 /100 | #163 | Good 46.8% |
| Immigrants | Kazakhstan | 70.0 /100 | #164 | Good 46.8% |
Demographics Similar to Romanians by Married-couple Households
In terms of married-couple households, the demographic groups most similar to Romanians are Jordanian (48.4%, a difference of 0.0%), Immigrants from South Eastern Asia (48.4%, a difference of 0.010%), Immigrants from China (48.4%, a difference of 0.010%), Immigrants from Canada (48.4%, a difference of 0.030%), and Northern European (48.4%, a difference of 0.050%).
| Demographics | Rating | Rank | Married-couple Households |
| Croatians | 99.1 /100 | #60 | Exceptional 48.5% |
| Bulgarians | 99.1 /100 | #61 | Exceptional 48.5% |
| Luxembourgers | 99.1 /100 | #62 | Exceptional 48.5% |
| Basques | 99.0 /100 | #63 | Exceptional 48.4% |
| Northern Europeans | 99.0 /100 | #64 | Exceptional 48.4% |
| Immigrants | Canada | 99.0 /100 | #65 | Exceptional 48.4% |
| Jordanians | 98.9 /100 | #66 | Exceptional 48.4% |
| Romanians | 98.9 /100 | #67 | Exceptional 48.4% |
| Immigrants | South Eastern Asia | 98.9 /100 | #68 | Exceptional 48.4% |
| Immigrants | China | 98.9 /100 | #69 | Exceptional 48.4% |
| Immigrants | North America | 98.9 /100 | #70 | Exceptional 48.4% |
| Laotians | 98.8 /100 | #71 | Exceptional 48.4% |
| Scotch-Irish | 98.6 /100 | #72 | Exceptional 48.3% |
| Immigrants | Singapore | 98.6 /100 | #73 | Exceptional 48.3% |
| Immigrants | Romania | 98.6 /100 | #74 | Exceptional 48.3% |