Menominee vs Romanian 4 or more Vehicles in Household
COMPARE
Menominee
Romanian
4 or more Vehicles in Household
4 or more Vehicles in Household Comparison
Menominee
Romanians
5.0%
4 OR MORE VEHICLES IN HOUSEHOLD
0.0/ 100
METRIC RATING
307th/ 347
METRIC RANK
6.2%
4 OR MORE VEHICLES IN HOUSEHOLD
30.7/ 100
METRIC RATING
192nd/ 347
METRIC RANK
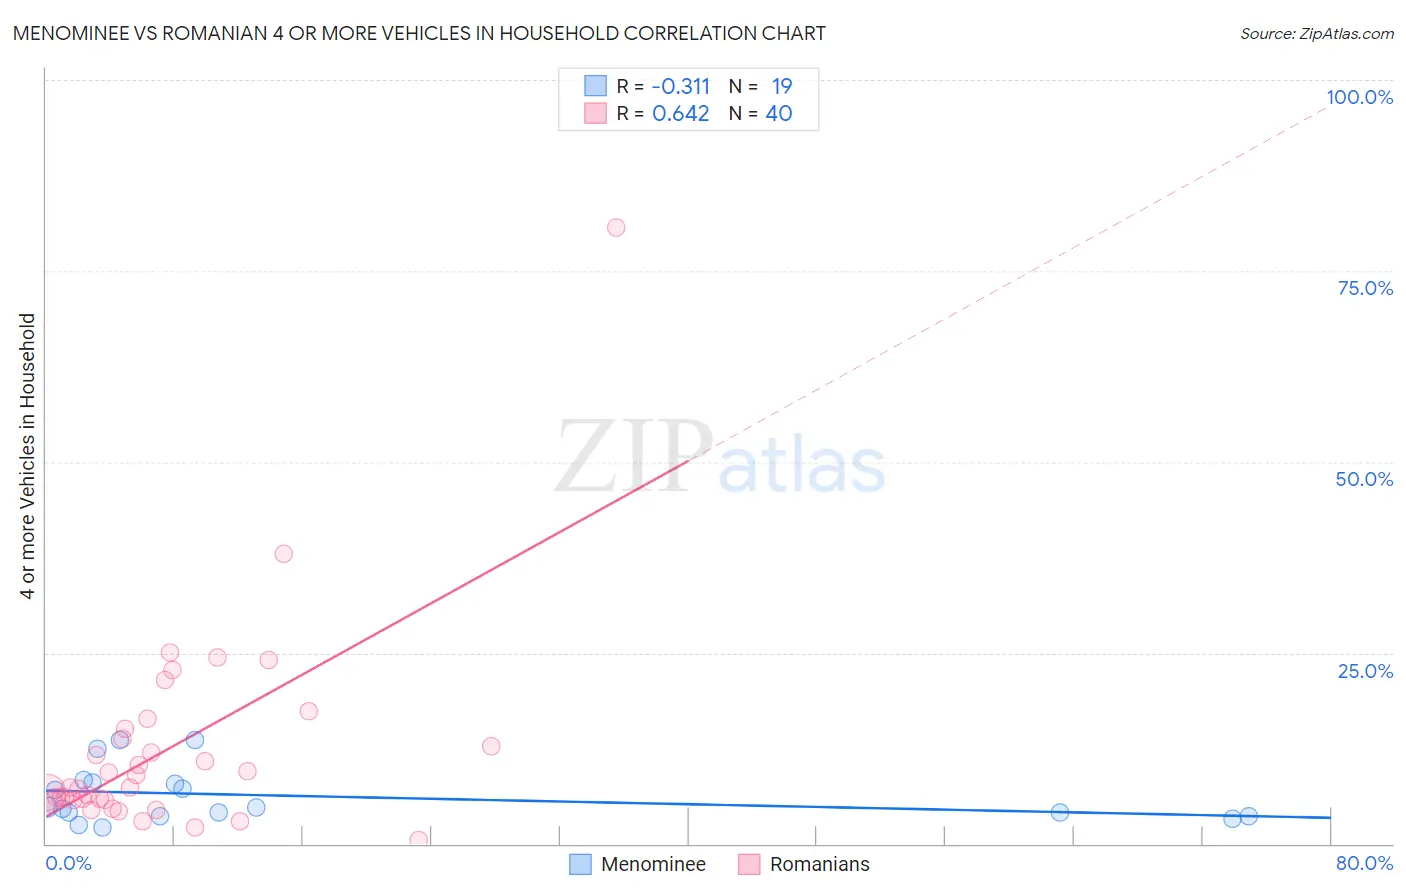
Menominee vs Romanian 4 or more Vehicles in Household Correlation Chart
The statistical analysis conducted on geographies consisting of 45,762,392 people shows a mild negative correlation between the proportion of Menominee and percentage of households with 4 or more vehicles available in the United States with a correlation coefficient (R) of -0.311 and weighted average of 5.0%. Similarly, the statistical analysis conducted on geographies consisting of 376,299,179 people shows a significant positive correlation between the proportion of Romanians and percentage of households with 4 or more vehicles available in the United States with a correlation coefficient (R) of 0.642 and weighted average of 6.2%, a difference of 24.5%.
4 or more Vehicles in Household Correlation Summary
| Measurement | Menominee | Romanian |
| Minimum | 2.2% | 0.45% |
| Maximum | 13.5% | 80.8% |
| Range | 11.3% | 80.3% |
| Mean | 6.3% | 12.3% |
| Median | 4.7% | 7.4% |
| Interquartile 25% (IQ1) | 3.7% | 5.8% |
| Interquartile 75% (IQ3) | 7.9% | 14.4% |
| Interquartile Range (IQR) | 4.3% | 8.6% |
| Standard Deviation (Sample) | 3.6% | 13.6% |
| Standard Deviation (Population) | 3.5% | 13.4% |
Similar Demographics by 4 or more Vehicles in Household
Demographics Similar to Menominee by 4 or more Vehicles in Household
In terms of 4 or more vehicles in household, the demographic groups most similar to Menominee are Paraguayan (4.9%, a difference of 0.72%), Immigrants from Somalia (4.9%, a difference of 0.87%), Immigrants from Serbia (5.0%, a difference of 0.94%), Cypriot (5.0%, a difference of 1.0%), and Somali (5.0%, a difference of 1.0%).
| Demographics | Rating | Rank | 4 or more Vehicles in Household |
| Immigrants | Morocco | 0.0 /100 | #300 | Tragic 5.1% |
| Immigrants | Zaire | 0.0 /100 | #301 | Tragic 5.1% |
| Bahamians | 0.0 /100 | #302 | Tragic 5.1% |
| Immigrants | Greece | 0.0 /100 | #303 | Tragic 5.1% |
| Cypriots | 0.0 /100 | #304 | Tragic 5.0% |
| Somalis | 0.0 /100 | #305 | Tragic 5.0% |
| Immigrants | Serbia | 0.0 /100 | #306 | Tragic 5.0% |
| Menominee | 0.0 /100 | #307 | Tragic 5.0% |
| Paraguayans | 0.0 /100 | #308 | Tragic 4.9% |
| Immigrants | Somalia | 0.0 /100 | #309 | Tragic 4.9% |
| Moroccans | 0.0 /100 | #310 | Tragic 4.9% |
| Houma | 0.0 /100 | #311 | Tragic 4.9% |
| Albanians | 0.0 /100 | #312 | Tragic 4.8% |
| Immigrants | Israel | 0.0 /100 | #313 | Tragic 4.8% |
| Immigrants | West Indies | 0.0 /100 | #314 | Tragic 4.7% |
Demographics Similar to Romanians by 4 or more Vehicles in Household
In terms of 4 or more vehicles in household, the demographic groups most similar to Romanians are Inupiat (6.2%, a difference of 0.010%), South African (6.2%, a difference of 0.19%), Immigrants from Eastern Asia (6.2%, a difference of 0.31%), Immigrants from Kuwait (6.2%, a difference of 0.34%), and Immigrants from Sweden (6.2%, a difference of 0.47%).
| Demographics | Rating | Rank | 4 or more Vehicles in Household |
| Thais | 36.9 /100 | #185 | Fair 6.2% |
| Immigrants | Northern Europe | 36.8 /100 | #186 | Fair 6.2% |
| Immigrants | South Africa | 35.4 /100 | #187 | Fair 6.2% |
| Kiowa | 34.7 /100 | #188 | Fair 6.2% |
| Immigrants | Eastern Asia | 33.3 /100 | #189 | Fair 6.2% |
| South Africans | 32.2 /100 | #190 | Fair 6.2% |
| Inupiat | 30.7 /100 | #191 | Fair 6.2% |
| Romanians | 30.7 /100 | #192 | Fair 6.2% |
| Immigrants | Kuwait | 28.0 /100 | #193 | Fair 6.2% |
| Immigrants | Sweden | 27.0 /100 | #194 | Fair 6.2% |
| Argentineans | 27.0 /100 | #195 | Fair 6.2% |
| Tsimshian | 26.4 /100 | #196 | Fair 6.2% |
| Immigrants | Sri Lanka | 23.7 /100 | #197 | Fair 6.1% |
| Immigrants | Portugal | 22.3 /100 | #198 | Fair 6.1% |
| Immigrants | Norway | 21.8 /100 | #199 | Fair 6.1% |