Immigrants from Oceania vs Colombian High School Diploma
COMPARE
Immigrants from Oceania
Colombian
High School Diploma
High School Diploma Comparison
Immigrants from Oceania
Colombians
88.8%
HIGH SCHOOL DIPLOMA
26.9/ 100
METRIC RATING
193rd/ 347
METRIC RANK
88.1%
HIGH SCHOOL DIPLOMA
3.8/ 100
METRIC RATING
231st/ 347
METRIC RANK
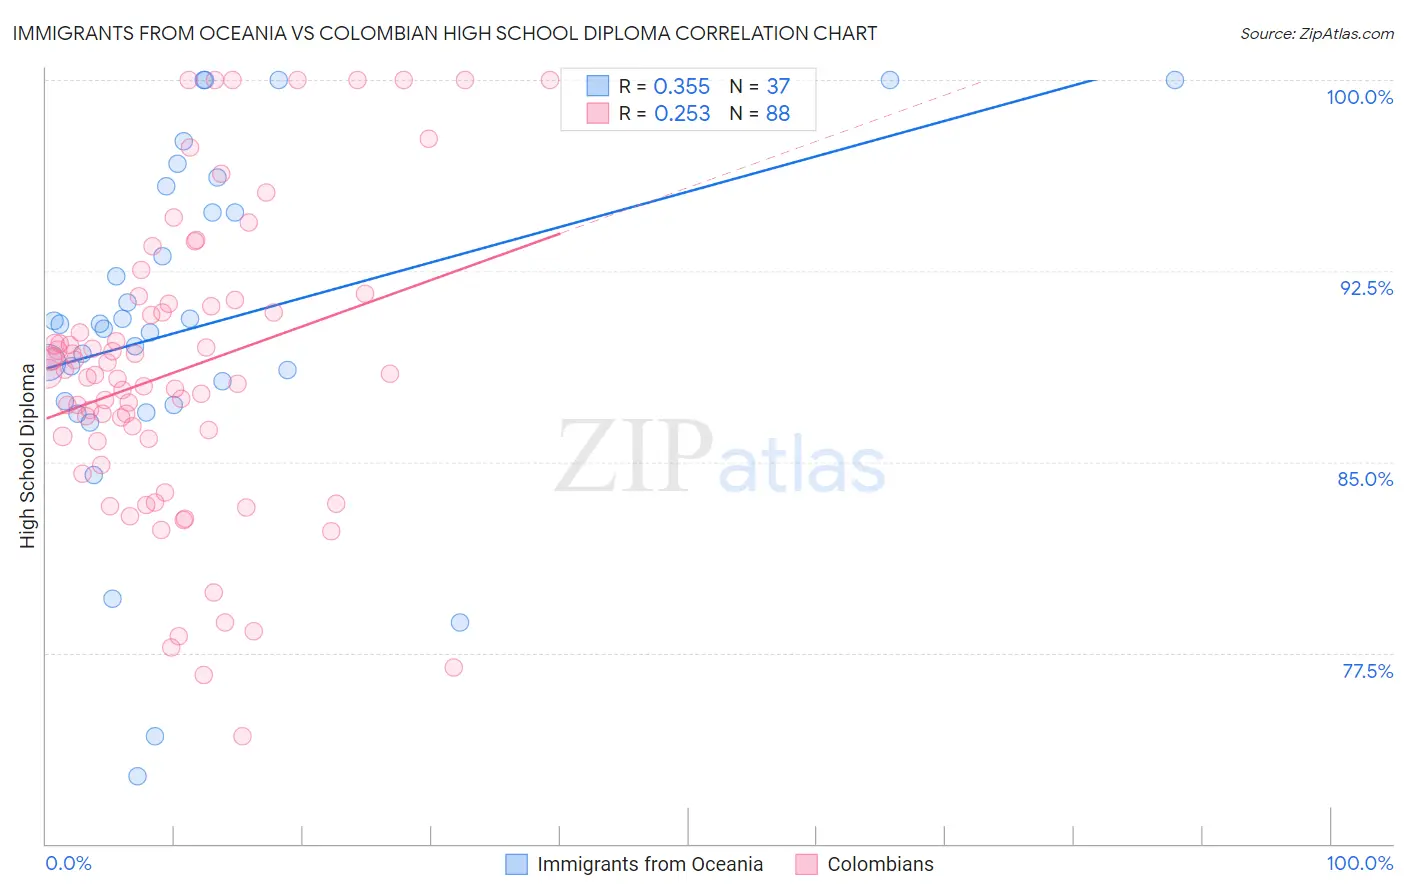
Immigrants from Oceania vs Colombian High School Diploma Correlation Chart
The statistical analysis conducted on geographies consisting of 305,521,521 people shows a mild positive correlation between the proportion of Immigrants from Oceania and percentage of population with at least high school diploma education in the United States with a correlation coefficient (R) of 0.355 and weighted average of 88.8%. Similarly, the statistical analysis conducted on geographies consisting of 419,701,311 people shows a weak positive correlation between the proportion of Colombians and percentage of population with at least high school diploma education in the United States with a correlation coefficient (R) of 0.253 and weighted average of 88.1%, a difference of 0.85%.
High School Diploma Correlation Summary
| Measurement | Immigrants from Oceania | Colombian |
| Minimum | 72.6% | 74.2% |
| Maximum | 100.0% | 100.0% |
| Range | 27.4% | 25.8% |
| Mean | 90.4% | 88.6% |
| Median | 90.4% | 88.4% |
| Interquartile 25% (IQ1) | 87.3% | 85.9% |
| Interquartile 75% (IQ3) | 95.3% | 91.2% |
| Interquartile Range (IQR) | 8.0% | 5.3% |
| Standard Deviation (Sample) | 6.7% | 5.8% |
| Standard Deviation (Population) | 6.6% | 5.8% |
Similar Demographics by High School Diploma
Demographics Similar to Immigrants from Oceania by High School Diploma
In terms of high school diploma, the demographic groups most similar to Immigrants from Oceania are Immigrants from Venezuela (88.8%, a difference of 0.020%), Moroccan (88.8%, a difference of 0.050%), Afghan (88.8%, a difference of 0.060%), Immigrants from Ethiopia (88.9%, a difference of 0.070%), and Immigrants from Southern Europe (88.7%, a difference of 0.070%).
| Demographics | Rating | Rank | High School Diploma |
| Immigrants | Eastern Africa | 35.8 /100 | #186 | Fair 88.9% |
| Guamanians/Chamorros | 35.5 /100 | #187 | Fair 88.9% |
| Immigrants | Sudan | 33.4 /100 | #188 | Fair 88.9% |
| Immigrants | Uganda | 32.6 /100 | #189 | Fair 88.9% |
| Immigrants | Chile | 31.9 /100 | #190 | Fair 88.9% |
| Immigrants | Ethiopia | 30.9 /100 | #191 | Fair 88.9% |
| Moroccans | 29.5 /100 | #192 | Fair 88.8% |
| Immigrants | Oceania | 26.9 /100 | #193 | Fair 88.8% |
| Immigrants | Venezuela | 25.8 /100 | #194 | Fair 88.8% |
| Afghans | 23.9 /100 | #195 | Fair 88.8% |
| Immigrants | Southern Europe | 23.4 /100 | #196 | Fair 88.7% |
| French American Indians | 21.5 /100 | #197 | Fair 88.7% |
| Liberians | 18.8 /100 | #198 | Poor 88.7% |
| Marshallese | 18.7 /100 | #199 | Poor 88.6% |
| Hawaiians | 18.3 /100 | #200 | Poor 88.6% |
Demographics Similar to Colombians by High School Diploma
In terms of high school diploma, the demographic groups most similar to Colombians are Blackfeet (88.1%, a difference of 0.040%), Immigrants from Middle Africa (88.0%, a difference of 0.050%), Immigrants from Panama (88.0%, a difference of 0.080%), Immigrants from Thailand (88.0%, a difference of 0.090%), and Immigrants from Bahamas (88.0%, a difference of 0.10%).
| Demographics | Rating | Rank | High School Diploma |
| Shoshone | 7.0 /100 | #224 | Tragic 88.3% |
| Creek | 6.9 /100 | #225 | Tragic 88.3% |
| Uruguayans | 5.6 /100 | #226 | Tragic 88.2% |
| Immigrants | Liberia | 5.5 /100 | #227 | Tragic 88.2% |
| Kiowa | 5.3 /100 | #228 | Tragic 88.2% |
| Nigerians | 5.2 /100 | #229 | Tragic 88.2% |
| Blackfeet | 4.2 /100 | #230 | Tragic 88.1% |
| Colombians | 3.8 /100 | #231 | Tragic 88.1% |
| Immigrants | Middle Africa | 3.4 /100 | #232 | Tragic 88.0% |
| Immigrants | Panama | 3.1 /100 | #233 | Tragic 88.0% |
| Immigrants | Thailand | 3.1 /100 | #234 | Tragic 88.0% |
| Immigrants | Bahamas | 2.9 /100 | #235 | Tragic 88.0% |
| Sub-Saharan Africans | 2.8 /100 | #236 | Tragic 87.9% |
| Taiwanese | 2.8 /100 | #237 | Tragic 87.9% |
| Sioux | 2.7 /100 | #238 | Tragic 87.9% |