Immigrants from North Macedonia vs Czech 2 or more Vehicles in Household
COMPARE
Immigrants from North Macedonia
Czech
2 or more Vehicles in Household
2 or more Vehicles in Household Comparison
Immigrants from North Macedonia
Czechs
54.4%
2 OR MORE VEHICLES IN HOUSEHOLD
14.9/ 100
METRIC RATING
202nd/ 347
METRIC RANK
61.5%
2 OR MORE VEHICLES IN HOUSEHOLD
100.0/ 100
METRIC RATING
14th/ 347
METRIC RANK
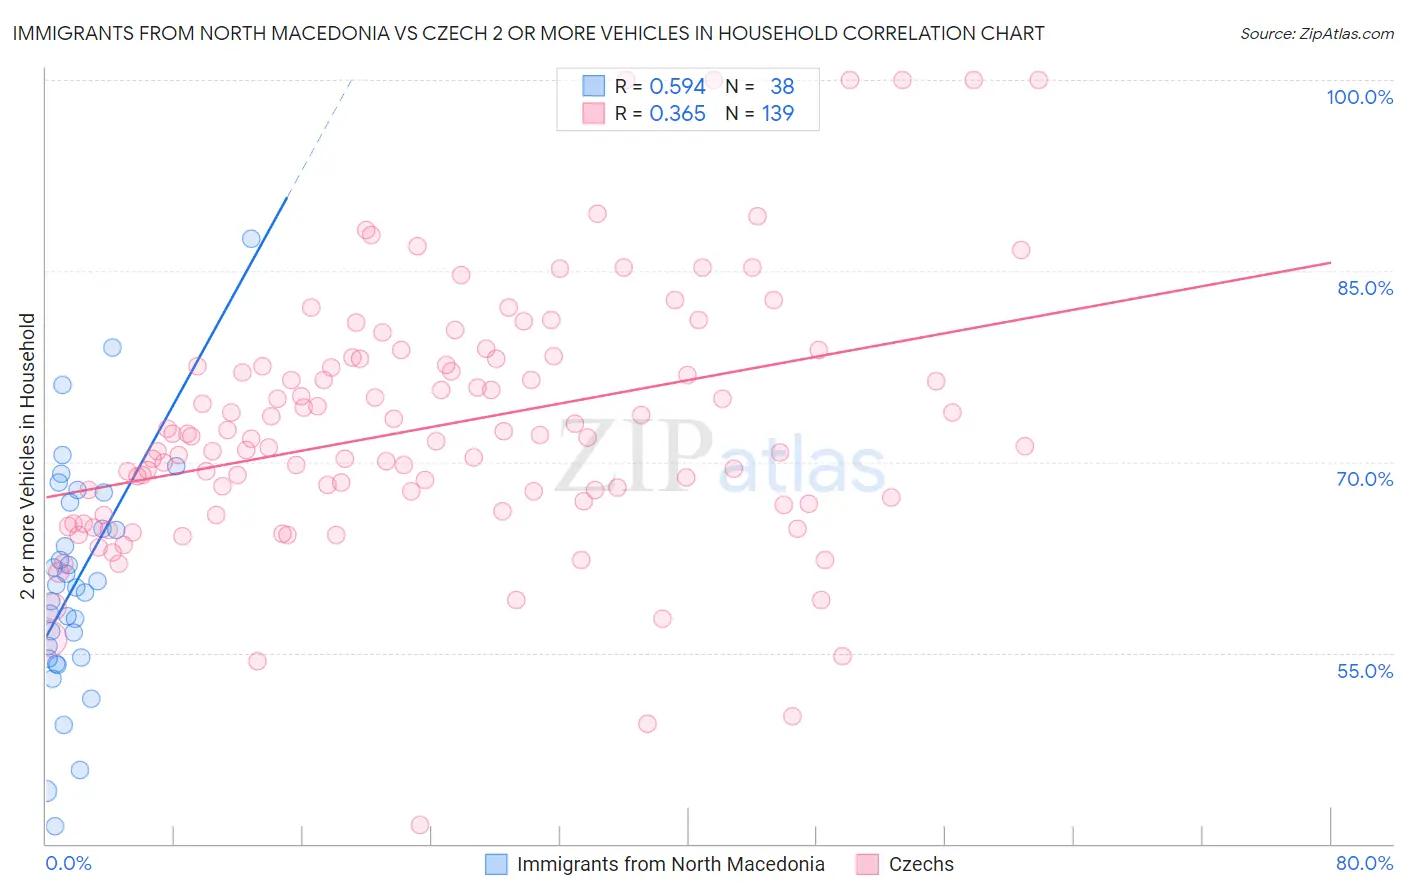
Immigrants from North Macedonia vs Czech 2 or more Vehicles in Household Correlation Chart
The statistical analysis conducted on geographies consisting of 74,306,697 people shows a substantial positive correlation between the proportion of Immigrants from North Macedonia and percentage of households with 2 or more vehicles available in the United States with a correlation coefficient (R) of 0.594 and weighted average of 54.4%. Similarly, the statistical analysis conducted on geographies consisting of 484,510,183 people shows a mild positive correlation between the proportion of Czechs and percentage of households with 2 or more vehicles available in the United States with a correlation coefficient (R) of 0.365 and weighted average of 61.5%, a difference of 13.0%.
2 or more Vehicles in Household Correlation Summary
| Measurement | Immigrants from North Macedonia | Czech |
| Minimum | 41.4% | 41.5% |
| Maximum | 87.5% | 100.0% |
| Range | 46.1% | 58.5% |
| Mean | 60.7% | 72.7% |
| Median | 60.2% | 71.8% |
| Interquartile 25% (IQ1) | 54.6% | 66.7% |
| Interquartile 75% (IQ3) | 66.8% | 77.6% |
| Interquartile Range (IQR) | 12.2% | 10.9% |
| Standard Deviation (Sample) | 9.3% | 10.1% |
| Standard Deviation (Population) | 9.1% | 10.0% |
Similar Demographics by 2 or more Vehicles in Household
Demographics Similar to Immigrants from North Macedonia by 2 or more Vehicles in Household
In terms of 2 or more vehicles in household, the demographic groups most similar to Immigrants from North Macedonia are Immigrants from Peru (54.4%, a difference of 0.040%), Immigrants from Italy (54.4%, a difference of 0.050%), Houma (54.4%, a difference of 0.070%), Immigrants from Norway (54.4%, a difference of 0.080%), and Immigrants from Belgium (54.3%, a difference of 0.090%).
| Demographics | Rating | Rank | 2 or more Vehicles in Household |
| Iroquois | 22.6 /100 | #195 | Fair 54.7% |
| Immigrants | Poland | 19.3 /100 | #196 | Poor 54.6% |
| Argentineans | 17.5 /100 | #197 | Poor 54.5% |
| Carpatho Rusyns | 16.2 /100 | #198 | Poor 54.4% |
| Immigrants | Norway | 15.9 /100 | #199 | Poor 54.4% |
| Houma | 15.8 /100 | #200 | Poor 54.4% |
| Immigrants | Italy | 15.5 /100 | #201 | Poor 54.4% |
| Immigrants | North Macedonia | 14.9 /100 | #202 | Poor 54.4% |
| Immigrants | Peru | 14.3 /100 | #203 | Poor 54.4% |
| Immigrants | Belgium | 13.7 /100 | #204 | Poor 54.3% |
| Cheyenne | 13.6 /100 | #205 | Poor 54.3% |
| Immigrants | Latin America | 13.1 /100 | #206 | Poor 54.3% |
| Turks | 13.0 /100 | #207 | Poor 54.3% |
| Egyptians | 12.0 /100 | #208 | Poor 54.3% |
| Immigrants | Bulgaria | 12.0 /100 | #209 | Poor 54.3% |
Demographics Similar to Czechs by 2 or more Vehicles in Household
In terms of 2 or more vehicles in household, the demographic groups most similar to Czechs are Samoan (61.5%, a difference of 0.050%), Nepalese (61.4%, a difference of 0.090%), Native Hawaiian (61.4%, a difference of 0.11%), German (61.6%, a difference of 0.16%), and Basque (61.4%, a difference of 0.18%).
| Demographics | Rating | Rank | 2 or more Vehicles in Household |
| Puget Sound Salish | 100.0 /100 | #7 | Exceptional 62.1% |
| English | 100.0 /100 | #8 | Exceptional 61.9% |
| Swedes | 100.0 /100 | #9 | Exceptional 61.8% |
| Mexicans | 100.0 /100 | #10 | Exceptional 61.7% |
| Dutch | 100.0 /100 | #11 | Exceptional 61.6% |
| Germans | 100.0 /100 | #12 | Exceptional 61.6% |
| Samoans | 100.0 /100 | #13 | Exceptional 61.5% |
| Czechs | 100.0 /100 | #14 | Exceptional 61.5% |
| Nepalese | 100.0 /100 | #15 | Exceptional 61.4% |
| Native Hawaiians | 100.0 /100 | #16 | Exceptional 61.4% |
| Basques | 100.0 /100 | #17 | Exceptional 61.4% |
| Europeans | 100.0 /100 | #18 | Exceptional 61.4% |
| Scottish | 100.0 /100 | #19 | Exceptional 61.2% |
| Sri Lankans | 100.0 /100 | #20 | Exceptional 61.0% |
| Koreans | 100.0 /100 | #21 | Exceptional 61.0% |