Immigrants from Morocco vs Immigrants from Philippines 2 or more Vehicles in Household
COMPARE
Immigrants from Morocco
Immigrants from Philippines
2 or more Vehicles in Household
2 or more Vehicles in Household Comparison
Immigrants from Morocco
Immigrants from Philippines
50.3%
2 OR MORE VEHICLES IN HOUSEHOLD
0.0/ 100
METRIC RATING
299th/ 347
METRIC RANK
60.1%
2 OR MORE VEHICLES IN HOUSEHOLD
100.0/ 100
METRIC RATING
35th/ 347
METRIC RANK
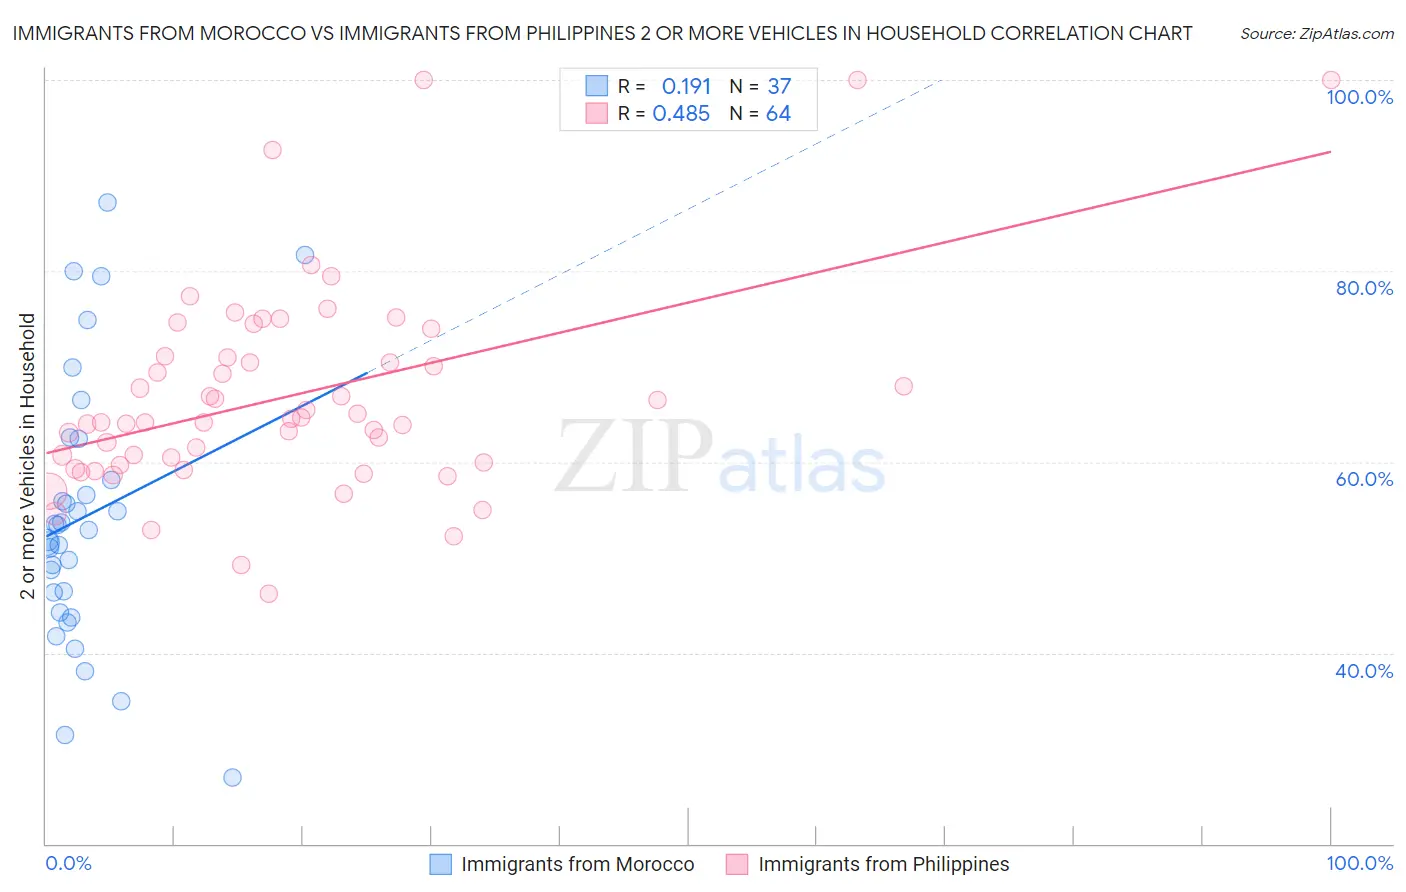
Immigrants from Morocco vs Immigrants from Philippines 2 or more Vehicles in Household Correlation Chart
The statistical analysis conducted on geographies consisting of 178,909,930 people shows a poor positive correlation between the proportion of Immigrants from Morocco and percentage of households with 2 or more vehicles available in the United States with a correlation coefficient (R) of 0.191 and weighted average of 50.3%. Similarly, the statistical analysis conducted on geographies consisting of 471,056,019 people shows a moderate positive correlation between the proportion of Immigrants from Philippines and percentage of households with 2 or more vehicles available in the United States with a correlation coefficient (R) of 0.485 and weighted average of 60.1%, a difference of 19.4%.
2 or more Vehicles in Household Correlation Summary
| Measurement | Immigrants from Morocco | Immigrants from Philippines |
| Minimum | 27.0% | 46.2% |
| Maximum | 87.2% | 100.0% |
| Range | 60.2% | 53.8% |
| Mean | 54.2% | 66.9% |
| Median | 52.9% | 64.3% |
| Interquartile 25% (IQ1) | 45.2% | 59.8% |
| Interquartile 75% (IQ3) | 60.3% | 71.0% |
| Interquartile Range (IQR) | 15.0% | 11.2% |
| Standard Deviation (Sample) | 13.9% | 10.9% |
| Standard Deviation (Population) | 13.7% | 10.8% |
Similar Demographics by 2 or more Vehicles in Household
Demographics Similar to Immigrants from Morocco by 2 or more Vehicles in Household
In terms of 2 or more vehicles in household, the demographic groups most similar to Immigrants from Morocco are Paraguayan (50.3%, a difference of 0.030%), Immigrants from Russia (50.3%, a difference of 0.040%), Immigrants from Spain (50.4%, a difference of 0.16%), Immigrants from Greece (50.2%, a difference of 0.22%), and Immigrants from South America (50.2%, a difference of 0.28%).
| Demographics | Rating | Rank | 2 or more Vehicles in Household |
| Immigrants | Ukraine | 0.0 /100 | #292 | Tragic 50.9% |
| Blacks/African Americans | 0.0 /100 | #293 | Tragic 50.9% |
| Bermudans | 0.0 /100 | #294 | Tragic 50.6% |
| Cypriots | 0.0 /100 | #295 | Tragic 50.6% |
| Immigrants | Somalia | 0.0 /100 | #296 | Tragic 50.5% |
| Immigrants | Spain | 0.0 /100 | #297 | Tragic 50.4% |
| Paraguayans | 0.0 /100 | #298 | Tragic 50.3% |
| Immigrants | Morocco | 0.0 /100 | #299 | Tragic 50.3% |
| Immigrants | Russia | 0.0 /100 | #300 | Tragic 50.3% |
| Immigrants | Greece | 0.0 /100 | #301 | Tragic 50.2% |
| Immigrants | South America | 0.0 /100 | #302 | Tragic 50.2% |
| Tohono O'odham | 0.0 /100 | #303 | Tragic 50.0% |
| Immigrants | Belize | 0.0 /100 | #304 | Tragic 49.9% |
| Immigrants | Western Africa | 0.0 /100 | #305 | Tragic 49.4% |
| Immigrants | Israel | 0.0 /100 | #306 | Tragic 49.2% |
Demographics Similar to Immigrants from Philippines by 2 or more Vehicles in Household
In terms of 2 or more vehicles in household, the demographic groups most similar to Immigrants from Philippines are Chinese (60.1%, a difference of 0.020%), Irish (60.1%, a difference of 0.060%), Spanish (60.2%, a difference of 0.12%), American (60.0%, a difference of 0.12%), and British (60.0%, a difference of 0.12%).
| Demographics | Rating | Rank | 2 or more Vehicles in Household |
| Guamanians/Chamorros | 100.0 /100 | #28 | Exceptional 60.5% |
| Hawaiians | 100.0 /100 | #29 | Exceptional 60.4% |
| Finns | 100.0 /100 | #30 | Exceptional 60.3% |
| Spanish American Indians | 100.0 /100 | #31 | Exceptional 60.3% |
| Arapaho | 100.0 /100 | #32 | Exceptional 60.2% |
| Immigrants | Mexico | 100.0 /100 | #33 | Exceptional 60.2% |
| Spanish | 100.0 /100 | #34 | Exceptional 60.2% |
| Immigrants | Philippines | 100.0 /100 | #35 | Exceptional 60.1% |
| Chinese | 100.0 /100 | #36 | Exceptional 60.1% |
| Irish | 100.0 /100 | #37 | Exceptional 60.1% |
| Americans | 100.0 /100 | #38 | Exceptional 60.0% |
| British | 100.0 /100 | #39 | Exceptional 60.0% |
| Cherokee | 100.0 /100 | #40 | Exceptional 59.9% |
| Northern Europeans | 100.0 /100 | #41 | Exceptional 59.9% |
| Malaysians | 100.0 /100 | #42 | Exceptional 59.8% |