Immigrants from Asia vs Immigrants from Philippines 2 or more Vehicles in Household
COMPARE
Immigrants from Asia
Immigrants from Philippines
2 or more Vehicles in Household
2 or more Vehicles in Household Comparison
Immigrants from Asia
Immigrants from Philippines
56.3%
2 OR MORE VEHICLES IN HOUSEHOLD
86.0/ 100
METRIC RATING
136th/ 347
METRIC RANK
60.1%
2 OR MORE VEHICLES IN HOUSEHOLD
100.0/ 100
METRIC RATING
35th/ 347
METRIC RANK
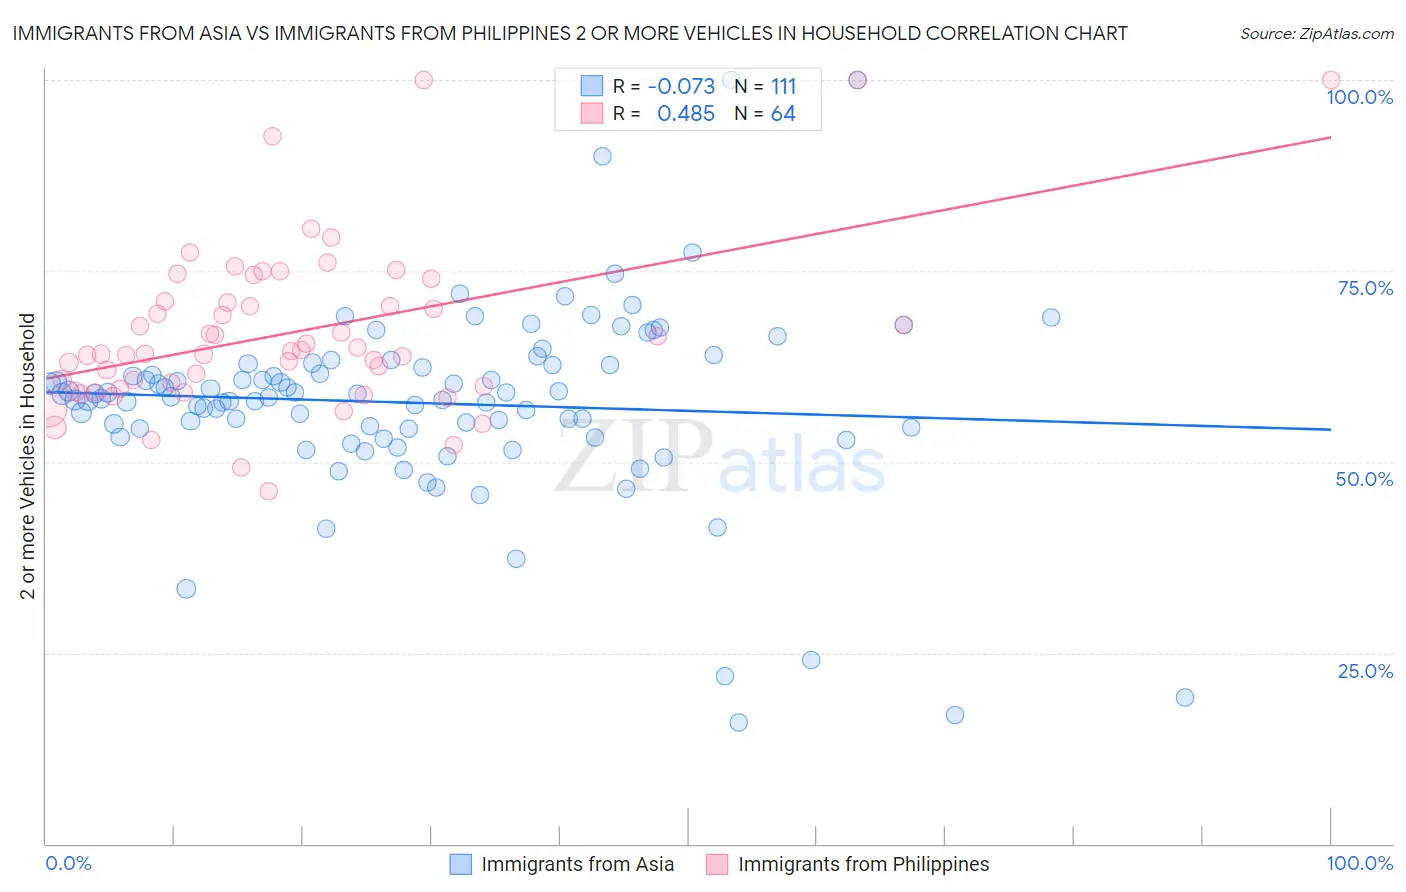
Immigrants from Asia vs Immigrants from Philippines 2 or more Vehicles in Household Correlation Chart
The statistical analysis conducted on geographies consisting of 548,501,460 people shows a slight negative correlation between the proportion of Immigrants from Asia and percentage of households with 2 or more vehicles available in the United States with a correlation coefficient (R) of -0.073 and weighted average of 56.3%. Similarly, the statistical analysis conducted on geographies consisting of 471,056,019 people shows a moderate positive correlation between the proportion of Immigrants from Philippines and percentage of households with 2 or more vehicles available in the United States with a correlation coefficient (R) of 0.485 and weighted average of 60.1%, a difference of 6.7%.
2 or more Vehicles in Household Correlation Summary
| Measurement | Immigrants from Asia | Immigrants from Philippines |
| Minimum | 15.8% | 46.2% |
| Maximum | 100.0% | 100.0% |
| Range | 84.2% | 53.8% |
| Mean | 57.7% | 66.9% |
| Median | 58.5% | 64.3% |
| Interquartile 25% (IQ1) | 54.4% | 59.8% |
| Interquartile 75% (IQ3) | 62.7% | 71.0% |
| Interquartile Range (IQR) | 8.2% | 11.2% |
| Standard Deviation (Sample) | 12.7% | 10.9% |
| Standard Deviation (Population) | 12.6% | 10.8% |
Similar Demographics by 2 or more Vehicles in Household
Demographics Similar to Immigrants from Asia by 2 or more Vehicles in Household
In terms of 2 or more vehicles in household, the demographic groups most similar to Immigrants from Asia are Blackfeet (56.4%, a difference of 0.040%), Immigrants from the Azores (56.4%, a difference of 0.050%), Cuban (56.3%, a difference of 0.090%), Salvadoran (56.3%, a difference of 0.10%), and Armenian (56.3%, a difference of 0.13%).
| Demographics | Rating | Rank | 2 or more Vehicles in Household |
| Ute | 90.4 /100 | #129 | Exceptional 56.6% |
| Yugoslavians | 90.0 /100 | #130 | Exceptional 56.6% |
| Bulgarians | 89.7 /100 | #131 | Excellent 56.5% |
| Hungarians | 89.1 /100 | #132 | Excellent 56.5% |
| Comanche | 88.4 /100 | #133 | Excellent 56.5% |
| Immigrants | Azores | 86.6 /100 | #134 | Excellent 56.4% |
| Blackfeet | 86.5 /100 | #135 | Excellent 56.4% |
| Immigrants | Asia | 86.0 /100 | #136 | Excellent 56.3% |
| Cubans | 84.8 /100 | #137 | Excellent 56.3% |
| Salvadorans | 84.7 /100 | #138 | Excellent 56.3% |
| Armenians | 84.3 /100 | #139 | Excellent 56.3% |
| Latvians | 83.6 /100 | #140 | Excellent 56.2% |
| Immigrants | Cambodia | 83.6 /100 | #141 | Excellent 56.2% |
| South Africans | 83.1 /100 | #142 | Excellent 56.2% |
| Seminole | 81.7 /100 | #143 | Excellent 56.2% |
Demographics Similar to Immigrants from Philippines by 2 or more Vehicles in Household
In terms of 2 or more vehicles in household, the demographic groups most similar to Immigrants from Philippines are Chinese (60.1%, a difference of 0.020%), Irish (60.1%, a difference of 0.060%), Spanish (60.2%, a difference of 0.12%), American (60.0%, a difference of 0.12%), and British (60.0%, a difference of 0.12%).
| Demographics | Rating | Rank | 2 or more Vehicles in Household |
| Guamanians/Chamorros | 100.0 /100 | #28 | Exceptional 60.5% |
| Hawaiians | 100.0 /100 | #29 | Exceptional 60.4% |
| Finns | 100.0 /100 | #30 | Exceptional 60.3% |
| Spanish American Indians | 100.0 /100 | #31 | Exceptional 60.3% |
| Arapaho | 100.0 /100 | #32 | Exceptional 60.2% |
| Immigrants | Mexico | 100.0 /100 | #33 | Exceptional 60.2% |
| Spanish | 100.0 /100 | #34 | Exceptional 60.2% |
| Immigrants | Philippines | 100.0 /100 | #35 | Exceptional 60.1% |
| Chinese | 100.0 /100 | #36 | Exceptional 60.1% |
| Irish | 100.0 /100 | #37 | Exceptional 60.1% |
| Americans | 100.0 /100 | #38 | Exceptional 60.0% |
| British | 100.0 /100 | #39 | Exceptional 60.0% |
| Cherokee | 100.0 /100 | #40 | Exceptional 59.9% |
| Northern Europeans | 100.0 /100 | #41 | Exceptional 59.9% |
| Malaysians | 100.0 /100 | #42 | Exceptional 59.8% |