Immigrants from Morocco vs Barbadian 2 or more Vehicles in Household
COMPARE
Immigrants from Morocco
Barbadian
2 or more Vehicles in Household
2 or more Vehicles in Household Comparison
Immigrants from Morocco
Barbadians
50.3%
2 OR MORE VEHICLES IN HOUSEHOLD
0.0/ 100
METRIC RATING
299th/ 347
METRIC RANK
38.3%
2 OR MORE VEHICLES IN HOUSEHOLD
0.0/ 100
METRIC RATING
337th/ 347
METRIC RANK
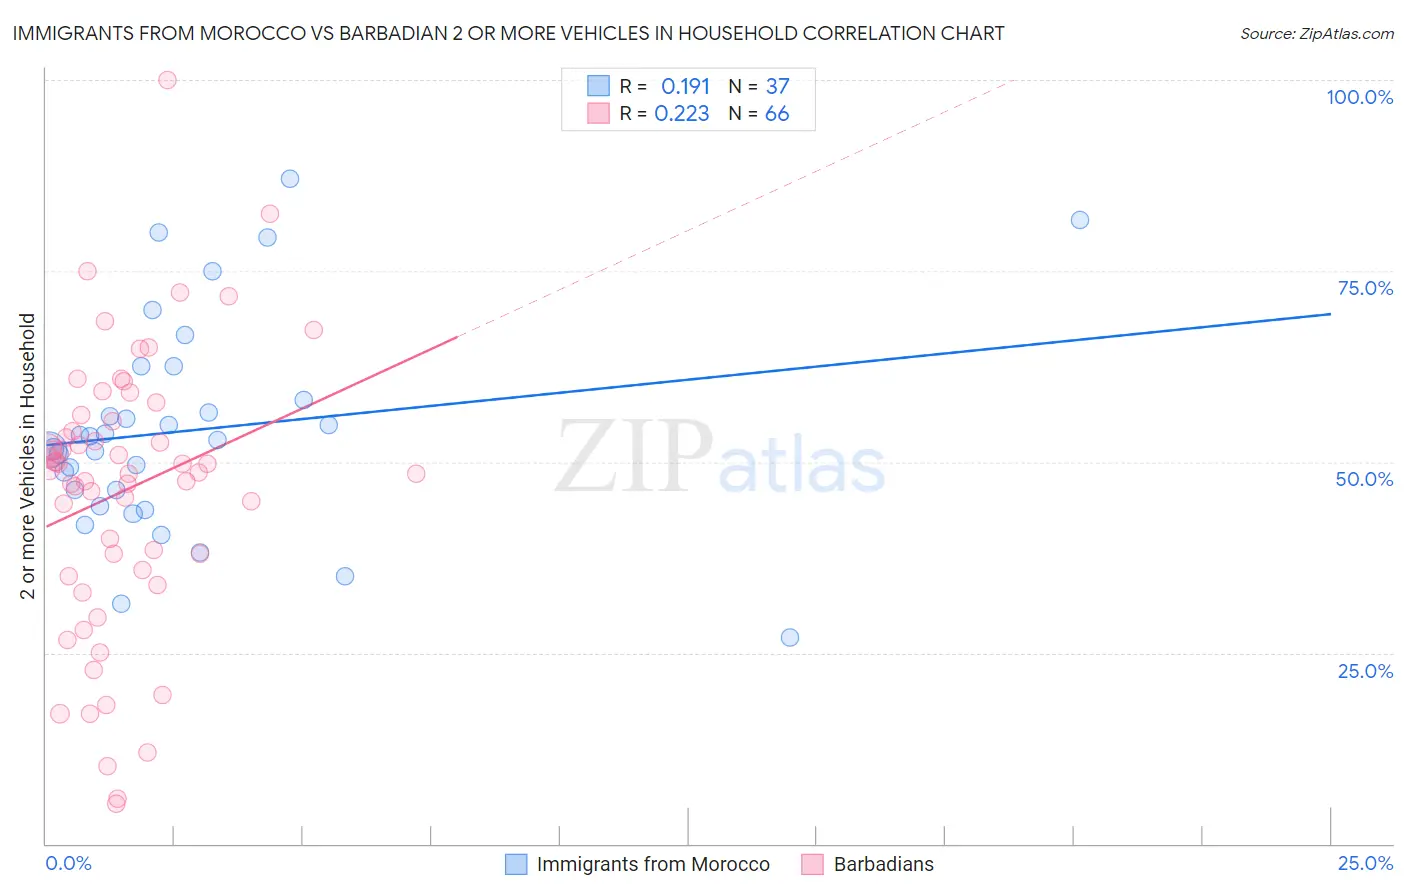
Immigrants from Morocco vs Barbadian 2 or more Vehicles in Household Correlation Chart
The statistical analysis conducted on geographies consisting of 178,909,930 people shows a poor positive correlation between the proportion of Immigrants from Morocco and percentage of households with 2 or more vehicles available in the United States with a correlation coefficient (R) of 0.191 and weighted average of 50.3%. Similarly, the statistical analysis conducted on geographies consisting of 141,285,511 people shows a weak positive correlation between the proportion of Barbadians and percentage of households with 2 or more vehicles available in the United States with a correlation coefficient (R) of 0.223 and weighted average of 38.3%, a difference of 31.2%.
2 or more Vehicles in Household Correlation Summary
| Measurement | Immigrants from Morocco | Barbadian |
| Minimum | 27.0% | 5.2% |
| Maximum | 87.2% | 100.0% |
| Range | 60.2% | 94.8% |
| Mean | 54.2% | 46.2% |
| Median | 52.9% | 48.8% |
| Interquartile 25% (IQ1) | 45.2% | 35.8% |
| Interquartile 75% (IQ3) | 60.3% | 55.4% |
| Interquartile Range (IQR) | 15.0% | 19.6% |
| Standard Deviation (Sample) | 13.9% | 18.2% |
| Standard Deviation (Population) | 13.7% | 18.0% |
Similar Demographics by 2 or more Vehicles in Household
Demographics Similar to Immigrants from Morocco by 2 or more Vehicles in Household
In terms of 2 or more vehicles in household, the demographic groups most similar to Immigrants from Morocco are Paraguayan (50.3%, a difference of 0.030%), Immigrants from Russia (50.3%, a difference of 0.040%), Immigrants from Spain (50.4%, a difference of 0.16%), Immigrants from Greece (50.2%, a difference of 0.22%), and Immigrants from South America (50.2%, a difference of 0.28%).
| Demographics | Rating | Rank | 2 or more Vehicles in Household |
| Immigrants | Ukraine | 0.0 /100 | #292 | Tragic 50.9% |
| Blacks/African Americans | 0.0 /100 | #293 | Tragic 50.9% |
| Bermudans | 0.0 /100 | #294 | Tragic 50.6% |
| Cypriots | 0.0 /100 | #295 | Tragic 50.6% |
| Immigrants | Somalia | 0.0 /100 | #296 | Tragic 50.5% |
| Immigrants | Spain | 0.0 /100 | #297 | Tragic 50.4% |
| Paraguayans | 0.0 /100 | #298 | Tragic 50.3% |
| Immigrants | Morocco | 0.0 /100 | #299 | Tragic 50.3% |
| Immigrants | Russia | 0.0 /100 | #300 | Tragic 50.3% |
| Immigrants | Greece | 0.0 /100 | #301 | Tragic 50.2% |
| Immigrants | South America | 0.0 /100 | #302 | Tragic 50.2% |
| Tohono O'odham | 0.0 /100 | #303 | Tragic 50.0% |
| Immigrants | Belize | 0.0 /100 | #304 | Tragic 49.9% |
| Immigrants | Western Africa | 0.0 /100 | #305 | Tragic 49.4% |
| Immigrants | Israel | 0.0 /100 | #306 | Tragic 49.2% |
Demographics Similar to Barbadians by 2 or more Vehicles in Household
In terms of 2 or more vehicles in household, the demographic groups most similar to Barbadians are Vietnamese (38.5%, a difference of 0.41%), Immigrants from Bangladesh (38.8%, a difference of 1.1%), Immigrants from Uzbekistan (37.9%, a difference of 1.2%), Immigrants from Trinidad and Tobago (40.3%, a difference of 5.0%), and Immigrants from Ecuador (40.5%, a difference of 5.6%).
| Demographics | Rating | Rank | 2 or more Vehicles in Household |
| Immigrants | Dominica | 0.0 /100 | #330 | Tragic 41.6% |
| West Indians | 0.0 /100 | #331 | Tragic 41.3% |
| Trinidadians and Tobagonians | 0.0 /100 | #332 | Tragic 40.9% |
| Immigrants | Ecuador | 0.0 /100 | #333 | Tragic 40.5% |
| Immigrants | Trinidad and Tobago | 0.0 /100 | #334 | Tragic 40.3% |
| Immigrants | Bangladesh | 0.0 /100 | #335 | Tragic 38.8% |
| Vietnamese | 0.0 /100 | #336 | Tragic 38.5% |
| Barbadians | 0.0 /100 | #337 | Tragic 38.3% |
| Immigrants | Uzbekistan | 0.0 /100 | #338 | Tragic 37.9% |
| Immigrants | Barbados | 0.0 /100 | #339 | Tragic 35.8% |
| British West Indians | 0.0 /100 | #340 | Tragic 35.4% |
| Guyanese | 0.0 /100 | #341 | Tragic 35.4% |
| Dominicans | 0.0 /100 | #342 | Tragic 35.3% |
| Immigrants | Guyana | 0.0 /100 | #343 | Tragic 35.0% |
| Yup'ik | 0.0 /100 | #344 | Tragic 34.9% |