Immigrants from Morocco vs Immigrants from Ireland 2 or more Vehicles in Household
COMPARE
Immigrants from Morocco
Immigrants from Ireland
2 or more Vehicles in Household
2 or more Vehicles in Household Comparison
Immigrants from Morocco
Immigrants from Ireland
50.3%
2 OR MORE VEHICLES IN HOUSEHOLD
0.0/ 100
METRIC RATING
299th/ 347
METRIC RANK
52.0%
2 OR MORE VEHICLES IN HOUSEHOLD
0.2/ 100
METRIC RATING
270th/ 347
METRIC RANK
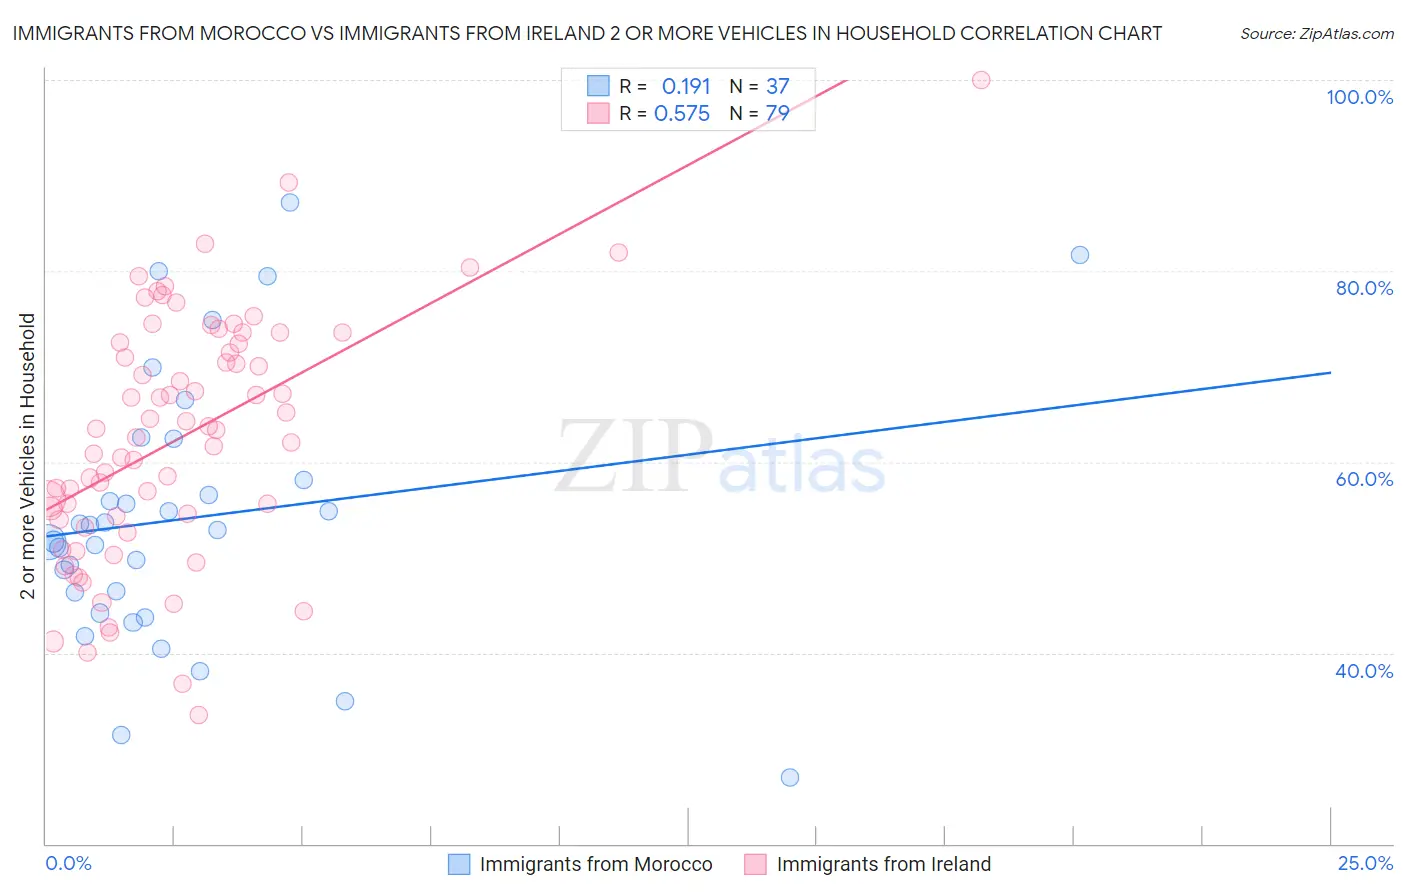
Immigrants from Morocco vs Immigrants from Ireland 2 or more Vehicles in Household Correlation Chart
The statistical analysis conducted on geographies consisting of 178,909,930 people shows a poor positive correlation between the proportion of Immigrants from Morocco and percentage of households with 2 or more vehicles available in the United States with a correlation coefficient (R) of 0.191 and weighted average of 50.3%. Similarly, the statistical analysis conducted on geographies consisting of 240,751,665 people shows a substantial positive correlation between the proportion of Immigrants from Ireland and percentage of households with 2 or more vehicles available in the United States with a correlation coefficient (R) of 0.575 and weighted average of 52.0%, a difference of 3.3%.
2 or more Vehicles in Household Correlation Summary
| Measurement | Immigrants from Morocco | Immigrants from Ireland |
| Minimum | 27.0% | 33.5% |
| Maximum | 87.2% | 100.0% |
| Range | 60.2% | 66.5% |
| Mean | 54.2% | 62.6% |
| Median | 52.9% | 63.4% |
| Interquartile 25% (IQ1) | 45.2% | 53.9% |
| Interquartile 75% (IQ3) | 60.3% | 72.5% |
| Interquartile Range (IQR) | 15.0% | 18.5% |
| Standard Deviation (Sample) | 13.9% | 12.8% |
| Standard Deviation (Population) | 13.7% | 12.8% |
Similar Demographics by 2 or more Vehicles in Household
Demographics Similar to Immigrants from Morocco by 2 or more Vehicles in Household
In terms of 2 or more vehicles in household, the demographic groups most similar to Immigrants from Morocco are Paraguayan (50.3%, a difference of 0.030%), Immigrants from Russia (50.3%, a difference of 0.040%), Immigrants from Spain (50.4%, a difference of 0.16%), Immigrants from Greece (50.2%, a difference of 0.22%), and Immigrants from South America (50.2%, a difference of 0.28%).
| Demographics | Rating | Rank | 2 or more Vehicles in Household |
| Immigrants | Ukraine | 0.0 /100 | #292 | Tragic 50.9% |
| Blacks/African Americans | 0.0 /100 | #293 | Tragic 50.9% |
| Bermudans | 0.0 /100 | #294 | Tragic 50.6% |
| Cypriots | 0.0 /100 | #295 | Tragic 50.6% |
| Immigrants | Somalia | 0.0 /100 | #296 | Tragic 50.5% |
| Immigrants | Spain | 0.0 /100 | #297 | Tragic 50.4% |
| Paraguayans | 0.0 /100 | #298 | Tragic 50.3% |
| Immigrants | Morocco | 0.0 /100 | #299 | Tragic 50.3% |
| Immigrants | Russia | 0.0 /100 | #300 | Tragic 50.3% |
| Immigrants | Greece | 0.0 /100 | #301 | Tragic 50.2% |
| Immigrants | South America | 0.0 /100 | #302 | Tragic 50.2% |
| Tohono O'odham | 0.0 /100 | #303 | Tragic 50.0% |
| Immigrants | Belize | 0.0 /100 | #304 | Tragic 49.9% |
| Immigrants | Western Africa | 0.0 /100 | #305 | Tragic 49.4% |
| Immigrants | Israel | 0.0 /100 | #306 | Tragic 49.2% |
Demographics Similar to Immigrants from Ireland by 2 or more Vehicles in Household
In terms of 2 or more vehicles in household, the demographic groups most similar to Immigrants from Ireland are Honduran (52.0%, a difference of 0.020%), Pima (52.0%, a difference of 0.030%), Immigrants from Colombia (52.0%, a difference of 0.040%), Immigrants from France (52.0%, a difference of 0.080%), and South American (51.9%, a difference of 0.17%).
| Demographics | Rating | Rank | 2 or more Vehicles in Household |
| Immigrants | Southern Europe | 0.4 /100 | #263 | Tragic 52.3% |
| Immigrants | Latvia | 0.4 /100 | #264 | Tragic 52.2% |
| Immigrants | Congo | 0.3 /100 | #265 | Tragic 52.1% |
| Immigrants | France | 0.2 /100 | #266 | Tragic 52.0% |
| Immigrants | Colombia | 0.2 /100 | #267 | Tragic 52.0% |
| Pima | 0.2 /100 | #268 | Tragic 52.0% |
| Hondurans | 0.2 /100 | #269 | Tragic 52.0% |
| Immigrants | Ireland | 0.2 /100 | #270 | Tragic 52.0% |
| South Americans | 0.2 /100 | #271 | Tragic 51.9% |
| Sub-Saharan Africans | 0.2 /100 | #272 | Tragic 51.9% |
| Israelis | 0.2 /100 | #273 | Tragic 51.9% |
| Africans | 0.2 /100 | #274 | Tragic 51.8% |
| Immigrants | Honduras | 0.2 /100 | #275 | Tragic 51.8% |
| Immigrants | Croatia | 0.2 /100 | #276 | Tragic 51.8% |
| Immigrants | Africa | 0.2 /100 | #277 | Tragic 51.8% |