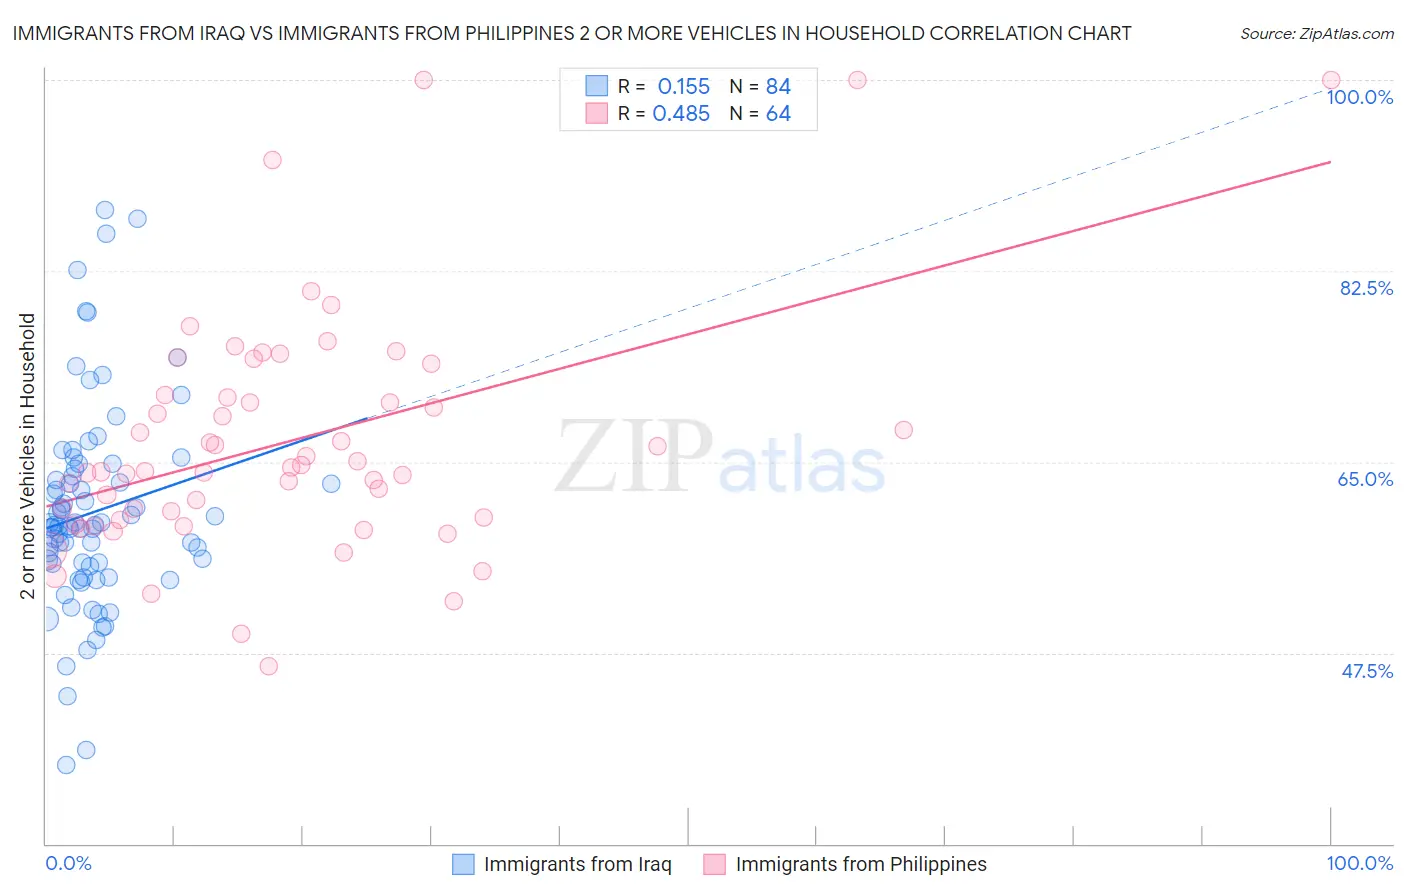
Immigrants from Iraq vs Immigrants from Philippines 2 or more Vehicles in Household
COMPARE
Immigrants from Iraq
Immigrants from Philippines
2 or more Vehicles in Household
2 or more Vehicles in Household Comparison
Immigrants from Iraq
Immigrants from Philippines
58.1%
2 OR MORE VEHICLES IN HOUSEHOLD
99.3/ 100
METRIC RATING
81st/ 347
METRIC RANK
60.1%
2 OR MORE VEHICLES IN HOUSEHOLD
100.0/ 100
METRIC RATING
35th/ 347
METRIC RANK
Immigrants from Iraq vs Immigrants from Philippines 2 or more Vehicles in Household Correlation Chart
The statistical analysis conducted on geographies consisting of 194,767,944 people shows a poor positive correlation between the proportion of Immigrants from Iraq and percentage of households with 2 or more vehicles available in the United States with a correlation coefficient (R) of 0.155 and weighted average of 58.1%. Similarly, the statistical analysis conducted on geographies consisting of 471,056,019 people shows a moderate positive correlation between the proportion of Immigrants from Philippines and percentage of households with 2 or more vehicles available in the United States with a correlation coefficient (R) of 0.485 and weighted average of 60.1%, a difference of 3.5%.
2 or more Vehicles in Household Correlation Summary
| Measurement | Immigrants from Iraq | Immigrants from Philippines |
| Minimum | 37.2% | 46.2% |
| Maximum | 88.1% | 100.0% |
| Range | 50.9% | 53.8% |
| Mean | 60.4% | 66.9% |
| Median | 59.2% | 64.3% |
| Interquartile 25% (IQ1) | 55.6% | 59.8% |
| Interquartile 75% (IQ3) | 64.0% | 71.0% |
| Interquartile Range (IQR) | 8.4% | 11.2% |
| Standard Deviation (Sample) | 9.5% | 10.9% |
| Standard Deviation (Population) | 9.4% | 10.8% |
Similar Demographics by 2 or more Vehicles in Household
Demographics Similar to Immigrants from Iraq by 2 or more Vehicles in Household
In terms of 2 or more vehicles in household, the demographic groups most similar to Immigrants from Iraq are Immigrants from England (58.1%, a difference of 0.010%), Iranian (58.1%, a difference of 0.080%), Icelander (58.0%, a difference of 0.12%), Delaware (58.2%, a difference of 0.16%), and Maltese (58.0%, a difference of 0.16%).
| Demographics | Rating | Rank | 2 or more Vehicles in Household |
| Immigrants | Afghanistan | 99.6 /100 | #74 | Exceptional 58.3% |
| Poles | 99.5 /100 | #75 | Exceptional 58.3% |
| Creek | 99.5 /100 | #76 | Exceptional 58.3% |
| Slovenes | 99.5 /100 | #77 | Exceptional 58.3% |
| Lithuanians | 99.5 /100 | #78 | Exceptional 58.2% |
| Delaware | 99.4 /100 | #79 | Exceptional 58.2% |
| Immigrants | England | 99.3 /100 | #80 | Exceptional 58.1% |
| Immigrants | Iraq | 99.3 /100 | #81 | Exceptional 58.1% |
| Iranians | 99.3 /100 | #82 | Exceptional 58.1% |
| Icelanders | 99.2 /100 | #83 | Exceptional 58.0% |
| Maltese | 99.2 /100 | #84 | Exceptional 58.0% |
| Slovaks | 99.2 /100 | #85 | Exceptional 58.0% |
| Potawatomi | 99.1 /100 | #86 | Exceptional 58.0% |
| Thais | 99.1 /100 | #87 | Exceptional 57.9% |
| Immigrants | Iran | 99.1 /100 | #88 | Exceptional 57.9% |
Demographics Similar to Immigrants from Philippines by 2 or more Vehicles in Household
In terms of 2 or more vehicles in household, the demographic groups most similar to Immigrants from Philippines are Chinese (60.1%, a difference of 0.020%), Irish (60.1%, a difference of 0.060%), Spanish (60.2%, a difference of 0.12%), American (60.0%, a difference of 0.12%), and British (60.0%, a difference of 0.12%).
| Demographics | Rating | Rank | 2 or more Vehicles in Household |
| Guamanians/Chamorros | 100.0 /100 | #28 | Exceptional 60.5% |
| Hawaiians | 100.0 /100 | #29 | Exceptional 60.4% |
| Finns | 100.0 /100 | #30 | Exceptional 60.3% |
| Spanish American Indians | 100.0 /100 | #31 | Exceptional 60.3% |
| Arapaho | 100.0 /100 | #32 | Exceptional 60.2% |
| Immigrants | Mexico | 100.0 /100 | #33 | Exceptional 60.2% |
| Spanish | 100.0 /100 | #34 | Exceptional 60.2% |
| Immigrants | Philippines | 100.0 /100 | #35 | Exceptional 60.1% |
| Chinese | 100.0 /100 | #36 | Exceptional 60.1% |
| Irish | 100.0 /100 | #37 | Exceptional 60.1% |
| Americans | 100.0 /100 | #38 | Exceptional 60.0% |
| British | 100.0 /100 | #39 | Exceptional 60.0% |
| Cherokee | 100.0 /100 | #40 | Exceptional 59.9% |
| Northern Europeans | 100.0 /100 | #41 | Exceptional 59.9% |
| Malaysians | 100.0 /100 | #42 | Exceptional 59.8% |