Immigrants from Morocco vs Immigrants from Philippines Unemployment Among Seniors over 75 years
COMPARE
Immigrants from Morocco
Immigrants from Philippines
Unemployment Among Seniors over 75 years
Unemployment Among Seniors over 75 years Comparison
Immigrants from Morocco
Immigrants from Philippines
7.9%
UNEMPLOYMENT AMONG SENIORS OVER 75 YEARS
99.9/ 100
METRIC RATING
60th/ 347
METRIC RANK
8.9%
UNEMPLOYMENT AMONG SENIORS OVER 75 YEARS
15.8/ 100
METRIC RATING
208th/ 347
METRIC RANK
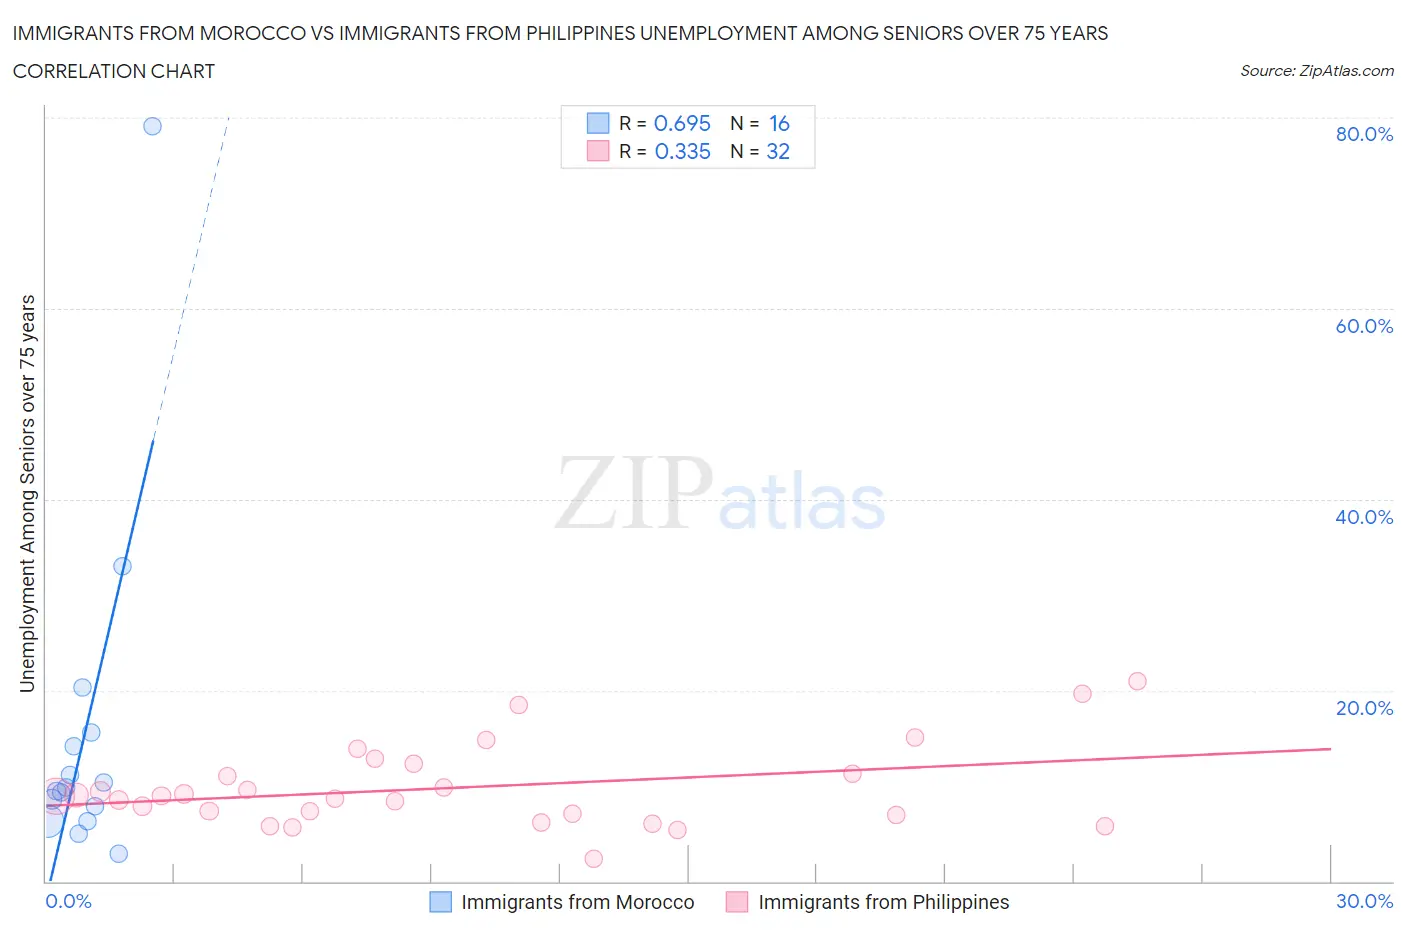
Immigrants from Morocco vs Immigrants from Philippines Unemployment Among Seniors over 75 years Correlation Chart
The statistical analysis conducted on geographies consisting of 119,157,817 people shows a significant positive correlation between the proportion of Immigrants from Morocco and unemployment rate among seniors over the age of 75 in the United States with a correlation coefficient (R) of 0.695 and weighted average of 7.9%. Similarly, the statistical analysis conducted on geographies consisting of 220,800,454 people shows a mild positive correlation between the proportion of Immigrants from Philippines and unemployment rate among seniors over the age of 75 in the United States with a correlation coefficient (R) of 0.335 and weighted average of 8.9%, a difference of 12.9%.
Unemployment Among Seniors over 75 years Correlation Summary
| Measurement | Immigrants from Morocco | Immigrants from Philippines |
| Minimum | 2.9% | 2.4% |
| Maximum | 79.1% | 21.0% |
| Range | 76.2% | 18.6% |
| Mean | 15.5% | 9.8% |
| Median | 9.6% | 8.9% |
| Interquartile 25% (IQ1) | 7.1% | 7.0% |
| Interquartile 75% (IQ3) | 14.8% | 11.8% |
| Interquartile Range (IQR) | 7.8% | 4.8% |
| Standard Deviation (Sample) | 18.4% | 4.3% |
| Standard Deviation (Population) | 17.8% | 4.3% |
Similar Demographics by Unemployment Among Seniors over 75 years
Demographics Similar to Immigrants from Morocco by Unemployment Among Seniors over 75 years
In terms of unemployment among seniors over 75 years, the demographic groups most similar to Immigrants from Morocco are Uruguayan (7.9%, a difference of 0.040%), Indonesian (7.9%, a difference of 0.050%), Immigrants from Albania (7.9%, a difference of 0.060%), Immigrants from Nicaragua (7.9%, a difference of 0.14%), and Immigrants from Taiwan (7.9%, a difference of 0.20%).
| Demographics | Rating | Rank | Unemployment Among Seniors over 75 years |
| Immigrants | Egypt | 100.0 /100 | #53 | Exceptional 7.9% |
| Immigrants | Malaysia | 99.9 /100 | #54 | Exceptional 7.9% |
| Filipinos | 99.9 /100 | #55 | Exceptional 7.9% |
| Immigrants | Eastern Asia | 99.9 /100 | #56 | Exceptional 7.9% |
| Ottawa | 99.9 /100 | #57 | Exceptional 7.9% |
| Iranians | 99.9 /100 | #58 | Exceptional 7.9% |
| Indonesians | 99.9 /100 | #59 | Exceptional 7.9% |
| Immigrants | Morocco | 99.9 /100 | #60 | Exceptional 7.9% |
| Uruguayans | 99.9 /100 | #61 | Exceptional 7.9% |
| Immigrants | Albania | 99.9 /100 | #62 | Exceptional 7.9% |
| Immigrants | Nicaragua | 99.9 /100 | #63 | Exceptional 7.9% |
| Immigrants | Taiwan | 99.9 /100 | #64 | Exceptional 7.9% |
| Argentineans | 99.9 /100 | #65 | Exceptional 7.9% |
| Immigrants | Austria | 99.9 /100 | #66 | Exceptional 8.0% |
| Immigrants | Syria | 99.9 /100 | #67 | Exceptional 8.0% |
Demographics Similar to Immigrants from Philippines by Unemployment Among Seniors over 75 years
In terms of unemployment among seniors over 75 years, the demographic groups most similar to Immigrants from Philippines are Malaysian (8.9%, a difference of 0.040%), Salvadoran (8.9%, a difference of 0.050%), Bermudan (8.9%, a difference of 0.080%), Delaware (9.0%, a difference of 0.13%), and Romanian (9.0%, a difference of 0.21%).
| Demographics | Rating | Rank | Unemployment Among Seniors over 75 years |
| Immigrants | Peru | 24.3 /100 | #201 | Fair 8.9% |
| Russians | 24.1 /100 | #202 | Fair 8.9% |
| Immigrants | Northern Europe | 23.9 /100 | #203 | Fair 8.9% |
| Spaniards | 22.0 /100 | #204 | Fair 8.9% |
| Koreans | 21.9 /100 | #205 | Fair 8.9% |
| Immigrants | Western Europe | 18.2 /100 | #206 | Poor 8.9% |
| Malaysians | 16.3 /100 | #207 | Poor 8.9% |
| Immigrants | Philippines | 15.8 /100 | #208 | Poor 8.9% |
| Salvadorans | 15.4 /100 | #209 | Poor 8.9% |
| Bermudans | 15.0 /100 | #210 | Poor 8.9% |
| Delaware | 14.6 /100 | #211 | Poor 9.0% |
| Romanians | 13.8 /100 | #212 | Poor 9.0% |
| Immigrants | Latin America | 13.4 /100 | #213 | Poor 9.0% |
| Immigrants | Brazil | 13.3 /100 | #214 | Poor 9.0% |
| Immigrants | Western Asia | 12.5 /100 | #215 | Poor 9.0% |