Immigrants from Morocco vs Immigrants from Philippines Family Poverty

COMPARE

Immigrants from Morocco
Race
Ancestry
AfghanAfricanAlaska NativeAlaskan AthabascanAlbanianAleutAlsatianAmericanApacheArabArapahoArgentineanArmenianAssyrian/Chaldean/SyriacAustralianAustrianBahamianBangladeshiBarbadianBasqueBelgianBelizeanBermudanBhutaneseBlackfeetBolivianBrazilianBritishBritish West IndianBulgarianBurmeseCajunCambodianCanadianCape VerdeanCarpatho RusynCelticCentral AmericanCentral American IndianCherokeeCheyenneChickasawChileanChineseChippewaChoctawColombianColvilleComancheCosta RicanCreeCreekCroatianCrowCubanCypriotCzechCzechoslovakianDanishDelawareDominicanDutchDutch West IndianEastern EuropeanEcuadorianEgyptianEnglishEstonianEthiopianEuropeanFijianFilipinoFinnishFrenchFrench American IndianFrench CanadianGermanGerman RussianGhanaianGreekGuamanian/ChamorroGuatemalanGuyaneseHaitianHmongHonduranHopiHoumaHungarianIcelanderIndian (Asian)IndonesianInupiatIranianIraqiIrishIroquoisIsraeliItalianJamaicanJapaneseJordanianKenyanKiowaKoreanLaotianLatvianLebaneseLiberianLithuanianLumbeeLuxembourgerMacedonianMalaysianMalteseMarshalleseMenomineeMexicanMexican American IndianMongolianMoroccanNative HawaiianNavajoNepaleseNew ZealanderNicaraguanNigerianNorthern EuropeanNorwegianOkinawanOsageOttawaPaiutePakistaniPalestinianPanamanianParaguayanPennsylvania GermanPeruvianPimaPolishPortuguesePotawatomiPuebloPuerto RicanPuget Sound SalishRomanianRussianSalvadoranSamoanScandinavianScotch-IrishScottishSeminoleSenegaleseSerbianShoshoneSierra LeoneanSiouxSlavicSlovakSloveneSomaliSouth AfricanSouth AmericanSouth American IndianSoviet UnionSpaniardSpanishSpanish AmericanSpanish American IndianSri LankanSubsaharan AfricanSudaneseSwedishSwissSyrianTaiwaneseThaiTlingit-HaidaTohono O'OdhamTonganTrinidadian and TobagonianTsimshianTurkishU.S. Virgin IslanderUgandanUkrainianUruguayanUteVenezuelanVietnameseWelshWest IndianYakamaYaquiYugoslavianYumanYup'ikZimbabwean
Immigration
NonimmigrantsImmigrantsAfghanistanAfricaAlbaniaArgentinaArmeniaAsiaAustraliaAustriaBahamasBangladeshBarbadosBelarusBelgiumBelizeBoliviaBosnia and HerzegovinaBrazilBulgariaBurma/MyanmarCabo VerdeCambodiaCameroonCanadaCaribbeanCentral AmericaChileChinaColombiaCongoCosta RicaCroatiaCubaCzechoslovakiaDenmarkDominicaDominican RepublicEastern AfricaEastern AsiaEastern EuropeEcuadorEgyptEl SalvadorEnglandEritreaEthiopiaEuropeFijiFranceGermanyGhanaGreeceGrenadaGuatemalaGuyanaHaitiHondurasHong KongHungaryIndiaIndonesiaIranIraqIrelandIsraelItalyJamaicaJapanJordanKazakhstanKenyaKoreaKuwaitLaosLatin AmericaLatviaLebanonLiberiaLithuaniaMalaysiaMexicoMicronesiaMiddle AfricaMoldovaMoroccoNepalNetherlandsNicaraguaNigeriaNorth AmericaNorth MacedoniaNorthern AfricaNorthern EuropeNorwayOceaniaPakistanPanamaPeruPolandPortugalRomaniaRussiaSaudi ArabiaScotlandSenegalSerbiaSierra LeoneSingaporeSomaliaSouth AfricaSouth AmericaSouth Central AsiaSouth Eastern AsiaSouthern EuropeSpainSri LankaSt. Vincent and the GrenadinesSudanSwedenSwitzerlandSyriaTaiwanThailandTrinidad and TobagoTurkeyUgandaUkraineUruguayUzbekistanVenezuelaVietnamWest IndiesWestern AfricaWestern AsiaWestern EuropeYemenZaireZimbabweAzores
Immigrants from Philippines
Race
Ancestry
AfghanAfricanAlaska NativeAlaskan AthabascanAlbanianAleutAlsatianAmericanApacheArabArapahoArgentineanArmenianAssyrian/Chaldean/SyriacAustralianAustrianBahamianBangladeshiBarbadianBasqueBelgianBelizeanBermudanBhutaneseBlackfeetBolivianBrazilianBritishBritish West IndianBulgarianBurmeseCajunCambodianCanadianCape VerdeanCarpatho RusynCelticCentral AmericanCentral American IndianCherokeeCheyenneChickasawChileanChineseChippewaChoctawColombianColvilleComancheCosta RicanCreeCreekCroatianCrowCubanCypriotCzechCzechoslovakianDanishDelawareDominicanDutchDutch West IndianEastern EuropeanEcuadorianEgyptianEnglishEstonianEthiopianEuropeanFijianFilipinoFinnishFrenchFrench American IndianFrench CanadianGermanGerman RussianGhanaianGreekGuamanian/ChamorroGuatemalanGuyaneseHaitianHmongHonduranHopiHoumaHungarianIcelanderIndian (Asian)IndonesianInupiatIranianIraqiIrishIroquoisIsraeliItalianJamaicanJapaneseJordanianKenyanKiowaKoreanLaotianLatvianLebaneseLiberianLithuanianLumbeeLuxembourgerMacedonianMalaysianMalteseMarshalleseMenomineeMexicanMexican American IndianMongolianMoroccanNative HawaiianNavajoNepaleseNew ZealanderNicaraguanNigerianNorthern EuropeanNorwegianOkinawanOsageOttawaPaiutePakistaniPalestinianPanamanianParaguayanPennsylvania GermanPeruvianPimaPolishPortuguesePotawatomiPuebloPuerto RicanPuget Sound SalishRomanianRussianSalvadoranSamoanScandinavianScotch-IrishScottishSeminoleSenegaleseSerbianShoshoneSierra LeoneanSiouxSlavicSlovakSloveneSomaliSouth AfricanSouth AmericanSouth American IndianSoviet UnionSpaniardSpanishSpanish AmericanSpanish American IndianSri LankanSubsaharan AfricanSudaneseSwedishSwissSyrianTaiwaneseThaiTlingit-HaidaTohono O'OdhamTonganTrinidadian and TobagonianTsimshianTurkishU.S. Virgin IslanderUgandanUkrainianUruguayanUteVenezuelanVietnameseWelshWest IndianYakamaYaquiYugoslavianYumanYup'ikZimbabwean
Immigration
NonimmigrantsImmigrantsAfghanistanAfricaAlbaniaArgentinaArmeniaAsiaAustraliaAustriaBahamasBangladeshBarbadosBelarusBelgiumBelizeBoliviaBosnia and HerzegovinaBrazilBulgariaBurma/MyanmarCabo VerdeCambodiaCameroonCanadaCaribbeanCentral AmericaChileChinaColombiaCongoCosta RicaCroatiaCubaCzechoslovakiaDenmarkDominicaDominican RepublicEastern AfricaEastern AsiaEastern EuropeEcuadorEgyptEl SalvadorEnglandEritreaEthiopiaEuropeFijiFranceGermanyGhanaGreeceGrenadaGuatemalaGuyanaHaitiHondurasHong KongHungaryIndiaIndonesiaIranIraqIrelandIsraelItalyJamaicaJapanJordanKazakhstanKenyaKoreaKuwaitLaosLatin AmericaLatviaLebanonLiberiaLithuaniaMalaysiaMexicoMicronesiaMiddle AfricaMoldovaNepalNetherlandsNicaraguaNigeriaNorth AmericaNorth MacedoniaNorthern AfricaNorthern EuropeNorwayOceaniaPakistanPanamaPeruPhilippinesPolandPortugalRomaniaRussiaSaudi ArabiaScotlandSenegalSerbiaSierra LeoneSingaporeSomaliaSouth AfricaSouth AmericaSouth Central AsiaSouth Eastern AsiaSouthern EuropeSpainSri LankaSt. Vincent and the GrenadinesSudanSwedenSwitzerlandSyriaTaiwanThailandTrinidad and TobagoTurkeyUgandaUkraineUruguayUzbekistanVenezuelaVietnamWest IndiesWestern AfricaWestern AsiaWestern EuropeYemenZaireZimbabweAzores
Family Poverty
Income
Poverty
Unemployment
Labor Participation
Family Structure
Vehicle Availability
Education Level
Disability

Family Poverty Comparison

Immigrants from Morocco

Immigrants from Philippines

Average
Exceptional
9.1%
FAMILY POVERTY
40.2/ 100
METRIC RATING
182nd/ 347
METRIC RANK
8.0%
FAMILY POVERTY
96.5/ 100
METRIC RATING
95th/ 347
METRIC RANK

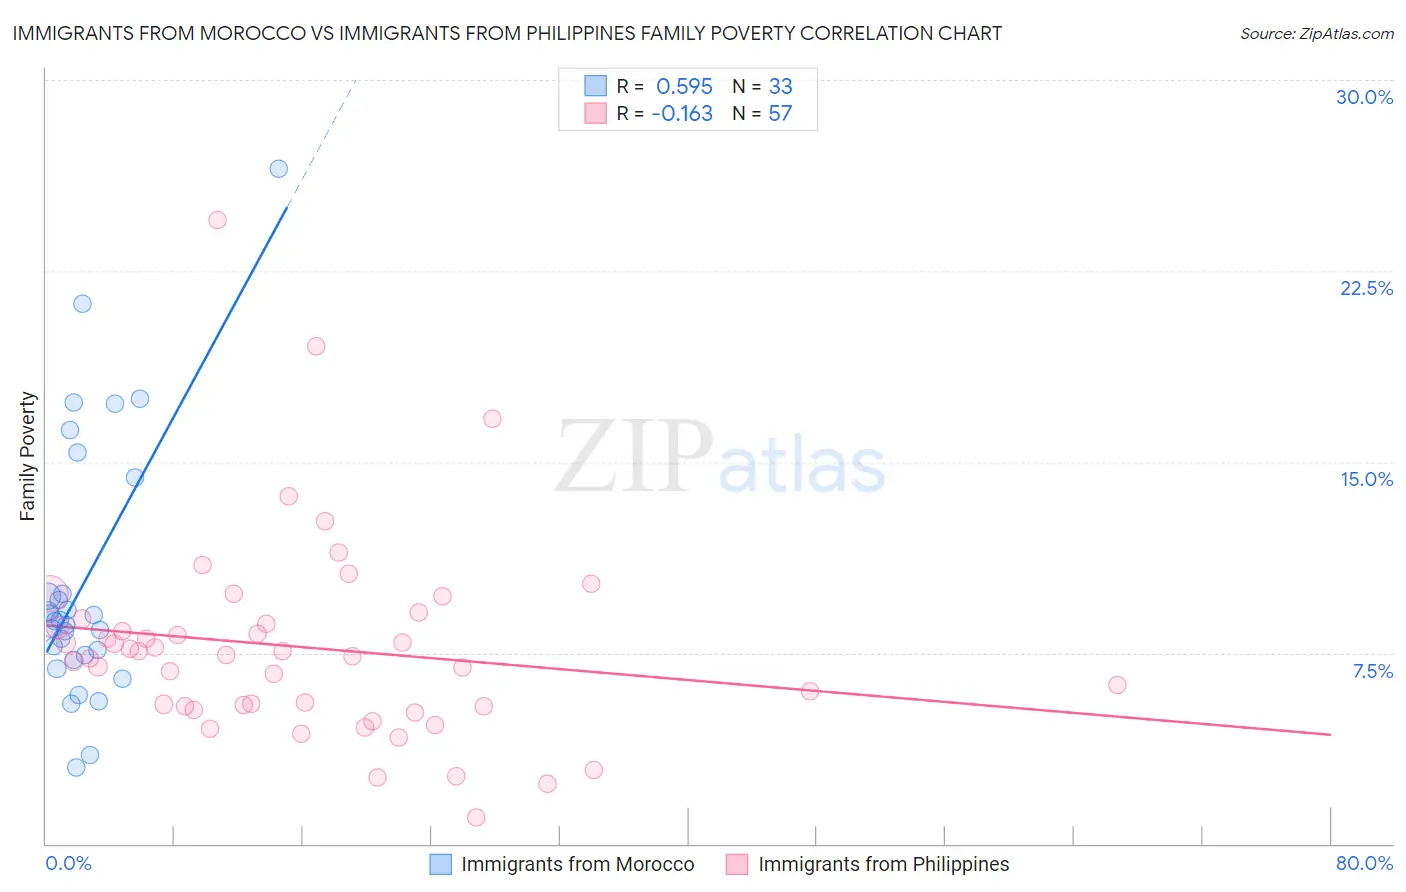
Immigrants from Morocco vs Immigrants from Philippines Family Poverty Correlation Chart

The statistical analysis conducted on geographies consisting of 178,782,527 people shows a substantial positive correlation between the proportion of Immigrants from Morocco and poverty level among families in the United States with a correlation coefficient (R) of 0.595 and weighted average of 9.1%. Similarly, the statistical analysis conducted on geographies consisting of 469,729,486 people shows a poor negative correlation between the proportion of Immigrants from Philippines and poverty level among families in the United States with a correlation coefficient (R) of -0.163 and weighted average of 8.0%, a difference of 13.7%.
Immigrants from Morocco vs Immigrants from Philippines Family Poverty

Family Poverty Correlation Summary

MeasurementImmigrants from MoroccoImmigrants from Philippines
Minimum3.0%1.1%
Maximum26.5%24.5%
Range23.5%23.5%
Mean10.2%7.7%
Median8.7%7.4%
Interquartile 25% (IQ1)7.3%5.4%
Interquartile 75% (IQ3)12.1%8.7%
Interquartile Range (IQR)4.8%3.3%
Standard Deviation (Sample)5.2%4.0%
Standard Deviation (Population)5.1%3.9%

Similar Demographics by Family Poverty

Demographics Similar to Immigrants from Morocco by Family Poverty

In terms of family poverty, the demographic groups most similar to Immigrants from Morocco are Hmong (9.1%, a difference of 0.010%), Uruguayan (9.1%, a difference of 0.13%), South American Indian (9.1%, a difference of 0.20%), Immigrants from Saudi Arabia (9.1%, a difference of 0.21%), and Immigrants from Uganda (9.1%, a difference of 0.43%).
DemographicsRating | RankFamily Poverty
Costa Ricans
49.3
/100
|
#175
Average
9.0%
Immigrants | Syria
47.5
/100
|
#176
Average
9.0%
Hawaiians
47.2
/100
|
#177
Average
9.0%
Immigrants | Cameroon
47.1
/100
|
#178
Average
9.0%
Immigrants | Iraq
44.4
/100
|
#179
Average
9.1%
Immigrants | Uganda
43.4
/100
|
#180
Average
9.1%
Hmong
40.2
/100
|
#181
Average
9.1%
Immigrants | Morocco
40.2
/100
|
#182
Average
9.1%
Uruguayans
39.2
/100
|
#183
Fair
9.1%
South American Indians
38.7
/100
|
#184
Fair
9.1%
Immigrants | Saudi Arabia
38.6
/100
|
#185
Fair
9.1%
Colombians
36.1
/100
|
#186
Fair
9.2%
Delaware
35.4
/100
|
#187
Fair
9.2%
Immigrants | Kenya
34.0
/100
|
#188
Fair
9.2%
Immigrants | Afghanistan
32.1
/100
|
#189
Fair
9.2%

Demographics Similar to Immigrants from Philippines by Family Poverty

In terms of family poverty, the demographic groups most similar to Immigrants from Philippines are Immigrants from Pakistan (8.0%, a difference of 0.010%), Immigrants from Turkey (8.0%, a difference of 0.020%), Tlingit-Haida (8.0%, a difference of 0.12%), Czechoslovakian (8.0%, a difference of 0.30%), and Immigrants from Switzerland (8.1%, a difference of 0.43%).
DemographicsRating | RankFamily Poverty
Serbians
97.2
/100
|
#88
Exceptional
8.0%
Immigrants | Denmark
97.1
/100
|
#89
Exceptional
8.0%
Immigrants | England
97.1
/100
|
#90
Exceptional
8.0%
Immigrants | Italy
97.0
/100
|
#91
Exceptional
8.0%
Czechoslovakians
96.8
/100
|
#92
Exceptional
8.0%
Tlingit-Haida
96.7
/100
|
#93
Exceptional
8.0%
Immigrants | Pakistan
96.6
/100
|
#94
Exceptional
8.0%
Immigrants | Philippines
96.5
/100
|
#95
Exceptional
8.0%
Immigrants | Turkey
96.5
/100
|
#96
Exceptional
8.0%
Immigrants | Switzerland
96.1
/100
|
#97
Exceptional
8.1%
Immigrants | South Africa
95.9
/100
|
#98
Exceptional
8.1%
Welsh
95.8
/100
|
#99
Exceptional
8.1%
New Zealanders
95.8
/100
|
#100
Exceptional
8.1%
Immigrants | Norway
95.7
/100
|
#101
Exceptional
8.1%
Immigrants | Indonesia
95.7
/100
|
#102
Exceptional
8.1%