Immigrants from Morocco vs Immigrants from South Central Asia 3 or more Vehicles in Household
COMPARE
Immigrants from Morocco
Immigrants from South Central Asia
3 or more Vehicles in Household
3 or more Vehicles in Household Comparison
Immigrants from Morocco
Immigrants from South Central Asia
16.3%
3 OR MORE VEHICLES IN HOUSEHOLD
0.0/ 100
METRIC RATING
305th/ 347
METRIC RANK
19.3%
3 OR MORE VEHICLES IN HOUSEHOLD
38.9/ 100
METRIC RATING
179th/ 347
METRIC RANK
Immigrants from Morocco vs Immigrants from South Central Asia 3 or more Vehicles in Household Correlation Chart
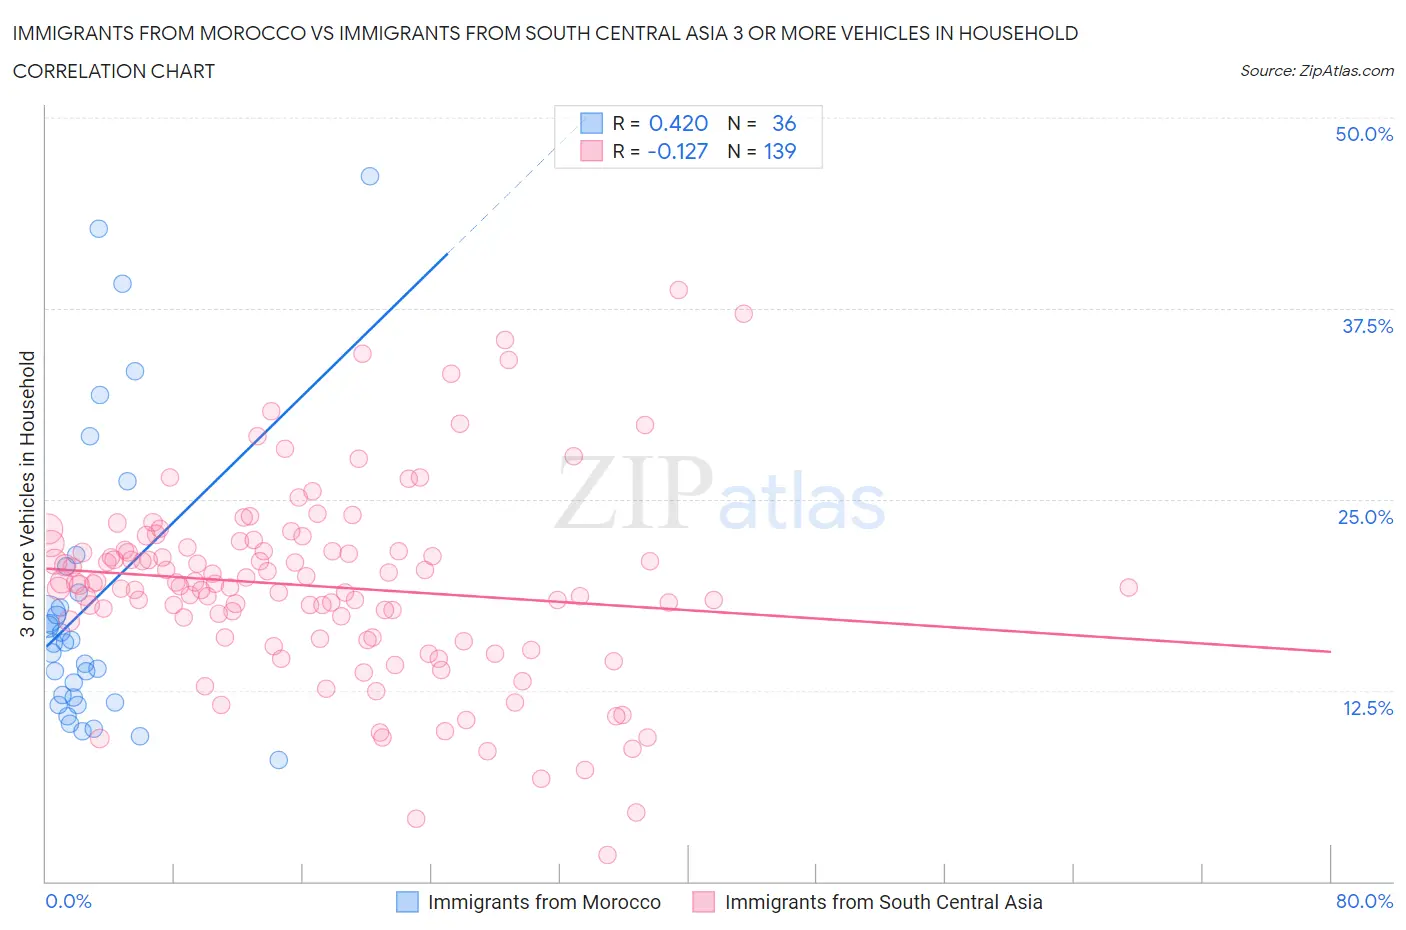
The statistical analysis conducted on geographies consisting of 178,908,758 people shows a moderate positive correlation between the proportion of Immigrants from Morocco and percentage of households with 3 or more vehicles available in the United States with a correlation coefficient (R) of 0.420 and weighted average of 16.3%. Similarly, the statistical analysis conducted on geographies consisting of 472,461,759 people shows a poor negative correlation between the proportion of Immigrants from South Central Asia and percentage of households with 3 or more vehicles available in the United States with a correlation coefficient (R) of -0.127 and weighted average of 19.3%, a difference of 18.5%.
3 or more Vehicles in Household Correlation Summary
| Measurement | Immigrants from Morocco | Immigrants from South Central Asia |
| Minimum | 7.9% | 1.7% |
| Maximum | 46.2% | 38.7% |
| Range | 38.2% | 37.0% |
| Mean | 18.3% | 19.3% |
| Median | 15.6% | 19.5% |
| Interquartile 25% (IQ1) | 11.8% | 15.9% |
| Interquartile 75% (IQ3) | 19.8% | 21.7% |
| Interquartile Range (IQR) | 8.0% | 5.8% |
| Standard Deviation (Sample) | 9.6% | 6.3% |
| Standard Deviation (Population) | 9.5% | 6.2% |
Similar Demographics by 3 or more Vehicles in Household
Demographics Similar to Immigrants from Morocco by 3 or more Vehicles in Household
In terms of 3 or more vehicles in household, the demographic groups most similar to Immigrants from Morocco are Ghanaian (16.4%, a difference of 0.26%), Immigrants from Serbia (16.4%, a difference of 0.74%), Somali (16.2%, a difference of 0.82%), Immigrants from Ghana (16.2%, a difference of 0.96%), and Immigrants from Greece (16.5%, a difference of 1.0%).
| Demographics | Rating | Rank | 3 or more Vehicles in Household |
| Immigrants | Zaire | 0.1 /100 | #298 | Tragic 16.7% |
| Immigrants | South America | 0.1 /100 | #299 | Tragic 16.7% |
| Cypriots | 0.0 /100 | #300 | Tragic 16.6% |
| Paraguayans | 0.0 /100 | #301 | Tragic 16.6% |
| Immigrants | Greece | 0.0 /100 | #302 | Tragic 16.5% |
| Immigrants | Serbia | 0.0 /100 | #303 | Tragic 16.4% |
| Ghanaians | 0.0 /100 | #304 | Tragic 16.4% |
| Immigrants | Morocco | 0.0 /100 | #305 | Tragic 16.3% |
| Somalis | 0.0 /100 | #306 | Tragic 16.2% |
| Immigrants | Ghana | 0.0 /100 | #307 | Tragic 16.2% |
| Houma | 0.0 /100 | #308 | Tragic 16.1% |
| Immigrants | Somalia | 0.0 /100 | #309 | Tragic 15.9% |
| Moroccans | 0.0 /100 | #310 | Tragic 15.9% |
| Albanians | 0.0 /100 | #311 | Tragic 15.8% |
| Puerto Ricans | 0.0 /100 | #312 | Tragic 15.6% |
Demographics Similar to Immigrants from South Central Asia by 3 or more Vehicles in Household
In terms of 3 or more vehicles in household, the demographic groups most similar to Immigrants from South Central Asia are Immigrants from Syria (19.4%, a difference of 0.11%), South African (19.3%, a difference of 0.11%), Romanian (19.3%, a difference of 0.15%), Immigrants from Peru (19.4%, a difference of 0.17%), and Cuban (19.3%, a difference of 0.19%).
| Demographics | Rating | Rank | 3 or more Vehicles in Household |
| Kiowa | 50.9 /100 | #172 | Average 19.5% |
| Immigrants | Northern Europe | 50.2 /100 | #173 | Average 19.5% |
| Immigrants | South Africa | 50.0 /100 | #174 | Average 19.5% |
| Syrians | 47.0 /100 | #175 | Average 19.5% |
| Iroquois | 46.0 /100 | #176 | Average 19.4% |
| Immigrants | Peru | 41.1 /100 | #177 | Average 19.4% |
| Immigrants | Syria | 40.3 /100 | #178 | Average 19.4% |
| Immigrants | South Central Asia | 38.9 /100 | #179 | Fair 19.3% |
| South Africans | 37.5 /100 | #180 | Fair 19.3% |
| Romanians | 37.1 /100 | #181 | Fair 19.3% |
| Cubans | 36.6 /100 | #182 | Fair 19.3% |
| Cajuns | 36.0 /100 | #183 | Fair 19.3% |
| Latvians | 35.7 /100 | #184 | Fair 19.3% |
| Immigrants | Sri Lanka | 30.7 /100 | #185 | Fair 19.2% |
| Immigrants | Sweden | 29.0 /100 | #186 | Fair 19.2% |