Immigrants from Morocco vs Immigrants from Ethiopia Self-Care Disability
COMPARE
Immigrants from Morocco
Immigrants from Ethiopia
Self-Care Disability
Self-Care Disability Comparison
Immigrants from Morocco
Immigrants from Ethiopia
2.4%
SELF-CARE DISABILITY
90.2/ 100
METRIC RATING
124th/ 347
METRIC RANK
2.2%
SELF-CARE DISABILITY
100.0/ 100
METRIC RATING
12th/ 347
METRIC RANK
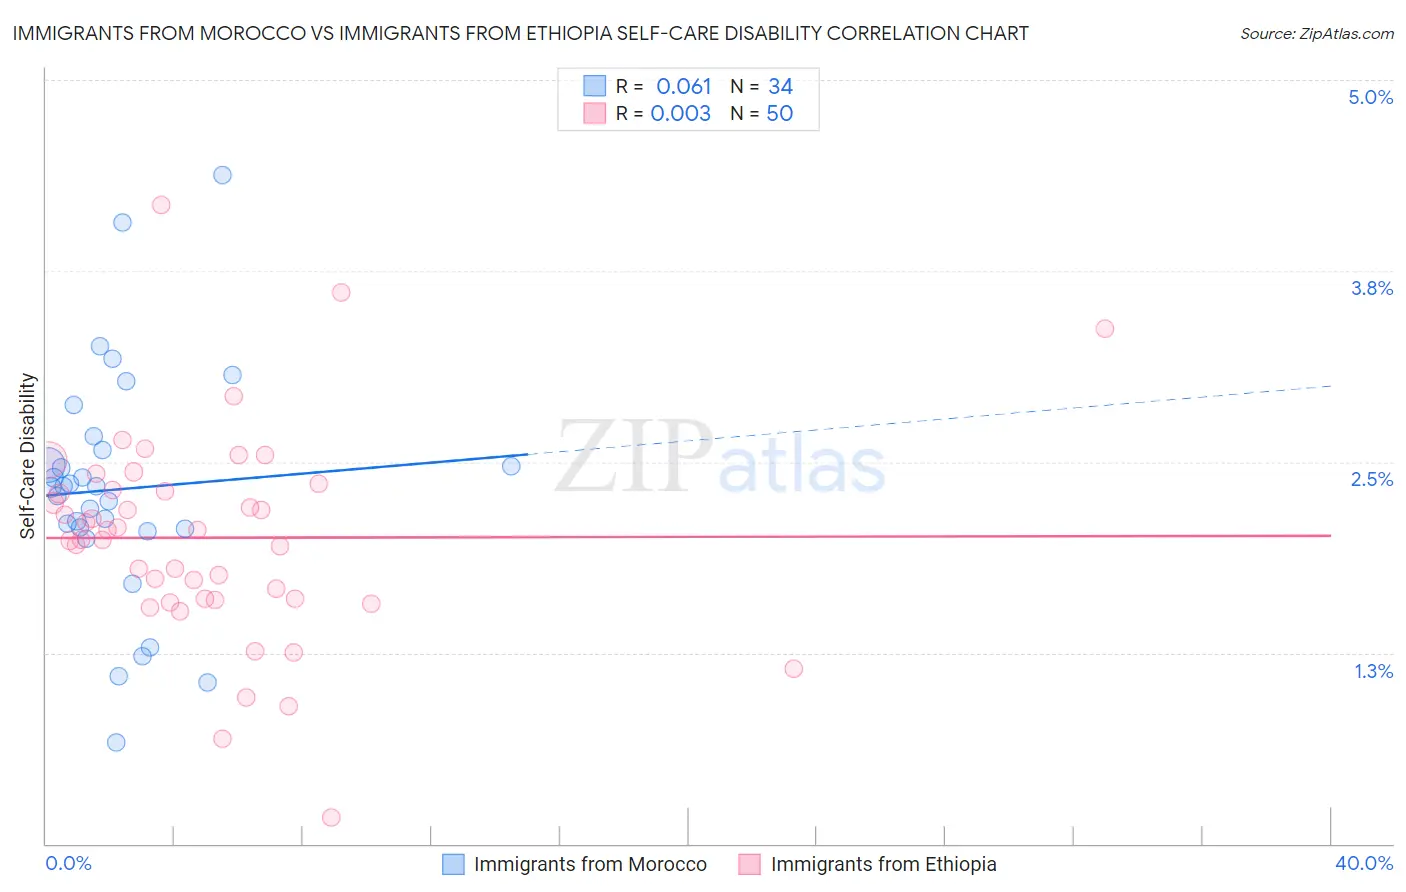
Immigrants from Morocco vs Immigrants from Ethiopia Self-Care Disability Correlation Chart
The statistical analysis conducted on geographies consisting of 178,885,702 people shows a slight positive correlation between the proportion of Immigrants from Morocco and percentage of population with self-care disability in the United States with a correlation coefficient (R) of 0.061 and weighted average of 2.4%. Similarly, the statistical analysis conducted on geographies consisting of 211,457,724 people shows no correlation between the proportion of Immigrants from Ethiopia and percentage of population with self-care disability in the United States with a correlation coefficient (R) of 0.003 and weighted average of 2.2%, a difference of 9.4%.
Self-Care Disability Correlation Summary
| Measurement | Immigrants from Morocco | Immigrants from Ethiopia |
| Minimum | 0.66% | 0.17% |
| Maximum | 4.4% | 4.2% |
| Range | 3.7% | 4.0% |
| Mean | 2.3% | 2.0% |
| Median | 2.3% | 2.0% |
| Interquartile 25% (IQ1) | 2.1% | 1.6% |
| Interquartile 75% (IQ3) | 2.6% | 2.3% |
| Interquartile Range (IQR) | 0.52% | 0.71% |
| Standard Deviation (Sample) | 0.77% | 0.69% |
| Standard Deviation (Population) | 0.76% | 0.69% |
Similar Demographics by Self-Care Disability
Demographics Similar to Immigrants from Morocco by Self-Care Disability
In terms of self-care disability, the demographic groups most similar to Immigrants from Morocco are Immigrants from North America (2.4%, a difference of 0.0%), Immigrants from Nigeria (2.4%, a difference of 0.010%), Hmong (2.4%, a difference of 0.040%), Colombian (2.4%, a difference of 0.070%), and Immigrants from Hungary (2.4%, a difference of 0.080%).
| Demographics | Rating | Rank | Self-Care Disability |
| Taiwanese | 92.5 /100 | #117 | Exceptional 2.4% |
| Immigrants | Canada | 92.0 /100 | #118 | Exceptional 2.4% |
| Immigrants | Sierra Leone | 91.8 /100 | #119 | Exceptional 2.4% |
| Uruguayans | 91.5 /100 | #120 | Exceptional 2.4% |
| Peruvians | 91.3 /100 | #121 | Exceptional 2.4% |
| Belgians | 90.9 /100 | #122 | Exceptional 2.4% |
| Immigrants | Nigeria | 90.3 /100 | #123 | Exceptional 2.4% |
| Immigrants | North America | 90.2 /100 | #124 | Exceptional 2.4% |
| Immigrants | Morocco | 90.2 /100 | #124 | Exceptional 2.4% |
| Hmong | 89.9 /100 | #126 | Excellent 2.4% |
| Colombians | 89.7 /100 | #127 | Excellent 2.4% |
| Immigrants | Hungary | 89.6 /100 | #128 | Excellent 2.4% |
| Immigrants | Romania | 89.3 /100 | #129 | Excellent 2.4% |
| Immigrants | Austria | 89.0 /100 | #130 | Excellent 2.4% |
| Poles | 88.9 /100 | #131 | Excellent 2.4% |
Demographics Similar to Immigrants from Ethiopia by Self-Care Disability
In terms of self-care disability, the demographic groups most similar to Immigrants from Ethiopia are Ethiopian (2.2%, a difference of 0.010%), Immigrants from South Central Asia (2.2%, a difference of 0.050%), Sudanese (2.2%, a difference of 0.16%), Luxembourger (2.2%, a difference of 0.17%), and Okinawan (2.2%, a difference of 0.18%).
| Demographics | Rating | Rank | Self-Care Disability |
| Zimbabweans | 100.0 /100 | #5 | Exceptional 2.2% |
| Filipinos | 100.0 /100 | #6 | Exceptional 2.2% |
| Immigrants | Bolivia | 100.0 /100 | #7 | Exceptional 2.2% |
| Bolivians | 100.0 /100 | #8 | Exceptional 2.2% |
| Immigrants | Nepal | 100.0 /100 | #9 | Exceptional 2.2% |
| Sudanese | 100.0 /100 | #10 | Exceptional 2.2% |
| Immigrants | South Central Asia | 100.0 /100 | #11 | Exceptional 2.2% |
| Immigrants | Ethiopia | 100.0 /100 | #12 | Exceptional 2.2% |
| Ethiopians | 100.0 /100 | #13 | Exceptional 2.2% |
| Luxembourgers | 100.0 /100 | #14 | Exceptional 2.2% |
| Okinawans | 100.0 /100 | #15 | Exceptional 2.2% |
| Immigrants | Kuwait | 100.0 /100 | #16 | Exceptional 2.2% |
| Immigrants | Saudi Arabia | 100.0 /100 | #17 | Exceptional 2.2% |
| Immigrants | Taiwan | 100.0 /100 | #18 | Exceptional 2.2% |
| Immigrants | Eritrea | 100.0 /100 | #19 | Exceptional 2.2% |