Immigrants from Malaysia vs Crow Bachelor's Degree
COMPARE
Immigrants from Malaysia
Crow
Bachelor's Degree
Bachelor's Degree Comparison
Immigrants from Malaysia
Crow
45.0%
BACHELOR'S DEGREE
100.0/ 100
METRIC RATING
41st/ 347
METRIC RANK
27.7%
BACHELOR'S DEGREE
0.0/ 100
METRIC RATING
328th/ 347
METRIC RANK
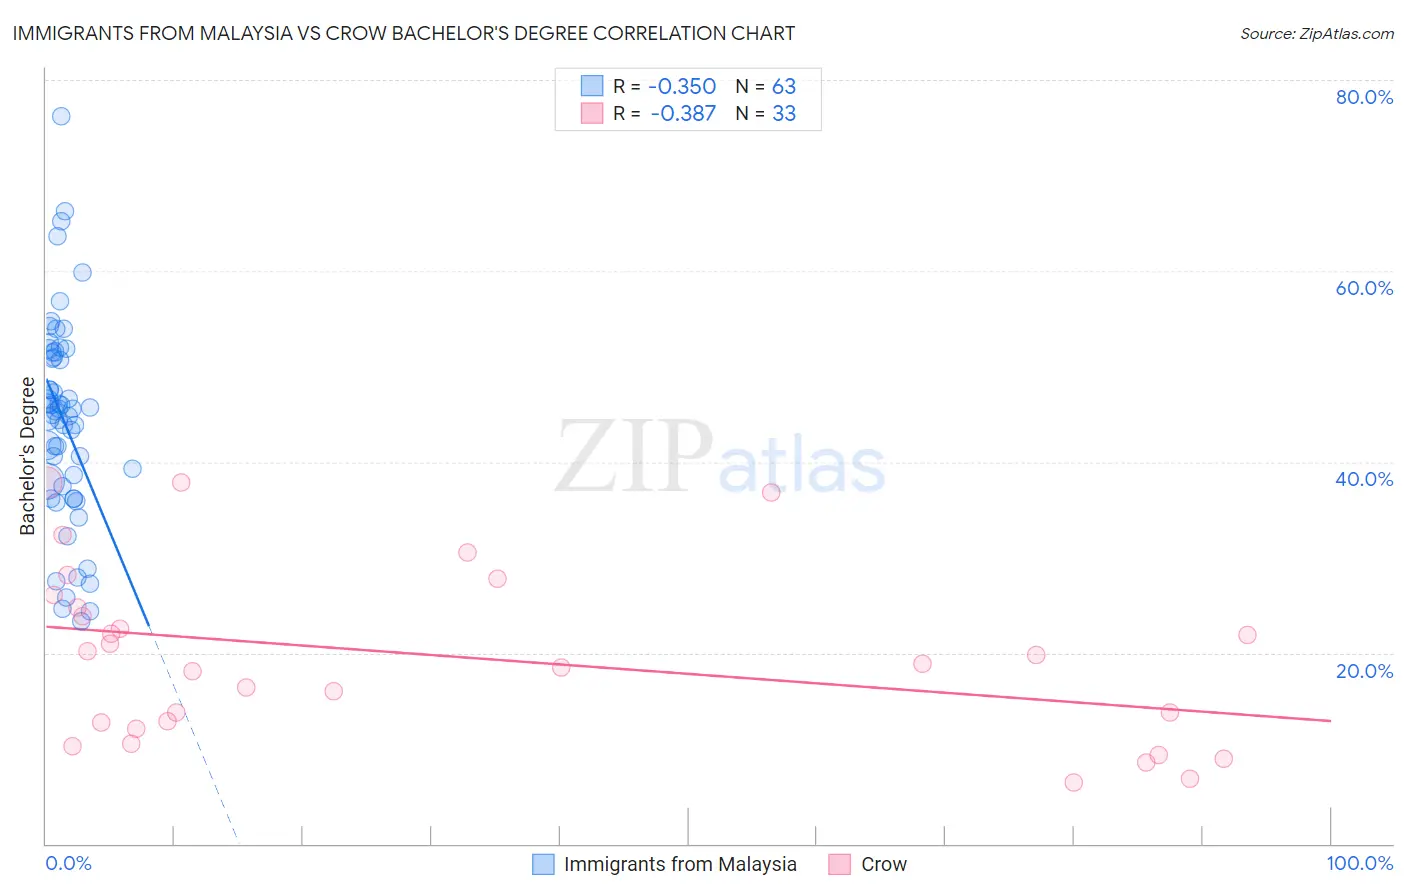
Immigrants from Malaysia vs Crow Bachelor's Degree Correlation Chart
The statistical analysis conducted on geographies consisting of 197,964,670 people shows a mild negative correlation between the proportion of Immigrants from Malaysia and percentage of population with at least bachelor's degree education in the United States with a correlation coefficient (R) of -0.350 and weighted average of 45.0%. Similarly, the statistical analysis conducted on geographies consisting of 59,206,788 people shows a mild negative correlation between the proportion of Crow and percentage of population with at least bachelor's degree education in the United States with a correlation coefficient (R) of -0.387 and weighted average of 27.7%, a difference of 62.2%.
Bachelor's Degree Correlation Summary
| Measurement | Immigrants from Malaysia | Crow |
| Minimum | 23.2% | 6.4% |
| Maximum | 76.2% | 37.8% |
| Range | 53.0% | 31.4% |
| Mean | 44.4% | 19.6% |
| Median | 45.3% | 18.8% |
| Interquartile 25% (IQ1) | 37.4% | 12.4% |
| Interquartile 75% (IQ3) | 51.4% | 25.3% |
| Interquartile Range (IQR) | 14.1% | 12.9% |
| Standard Deviation (Sample) | 10.7% | 9.0% |
| Standard Deviation (Population) | 10.6% | 8.8% |
Similar Demographics by Bachelor's Degree
Demographics Similar to Immigrants from Malaysia by Bachelor's Degree
In terms of bachelor's degree, the demographic groups most similar to Immigrants from Malaysia are Immigrants from Belarus (45.0%, a difference of 0.040%), Immigrants from Latvia (45.1%, a difference of 0.31%), Immigrants from Saudi Arabia (44.8%, a difference of 0.38%), Immigrants from South Africa (44.8%, a difference of 0.52%), and Bulgarian (45.3%, a difference of 0.64%).
| Demographics | Rating | Rank | Bachelor's Degree |
| Immigrants | Denmark | 100.0 /100 | #34 | Exceptional 45.4% |
| Immigrants | Russia | 100.0 /100 | #35 | Exceptional 45.4% |
| Mongolians | 100.0 /100 | #36 | Exceptional 45.4% |
| Russians | 100.0 /100 | #37 | Exceptional 45.3% |
| Bulgarians | 100.0 /100 | #38 | Exceptional 45.3% |
| Immigrants | Latvia | 100.0 /100 | #39 | Exceptional 45.1% |
| Immigrants | Belarus | 100.0 /100 | #40 | Exceptional 45.0% |
| Immigrants | Malaysia | 100.0 /100 | #41 | Exceptional 45.0% |
| Immigrants | Saudi Arabia | 100.0 /100 | #42 | Exceptional 44.8% |
| Immigrants | South Africa | 99.9 /100 | #43 | Exceptional 44.8% |
| Immigrants | Lithuania | 99.9 /100 | #44 | Exceptional 44.6% |
| Immigrants | Kuwait | 99.9 /100 | #45 | Exceptional 44.6% |
| Immigrants | Bulgaria | 99.9 /100 | #46 | Exceptional 44.6% |
| Bolivians | 99.9 /100 | #47 | Exceptional 44.6% |
| Estonians | 99.9 /100 | #48 | Exceptional 44.6% |
Demographics Similar to Crow by Bachelor's Degree
In terms of bachelor's degree, the demographic groups most similar to Crow are Immigrants from Central America (27.5%, a difference of 1.0%), Spanish American Indian (27.5%, a difference of 1.1%), Paiute (28.1%, a difference of 1.2%), Immigrants from the Azores (27.3%, a difference of 1.5%), and Menominee (27.3%, a difference of 1.7%).
| Demographics | Rating | Rank | Bachelor's Degree |
| Alaskan Athabascans | 0.0 /100 | #321 | Tragic 28.8% |
| Tsimshian | 0.0 /100 | #322 | Tragic 28.8% |
| Fijians | 0.0 /100 | #323 | Tragic 28.7% |
| Dutch West Indians | 0.0 /100 | #324 | Tragic 28.5% |
| Pennsylvania Germans | 0.0 /100 | #325 | Tragic 28.4% |
| Apache | 0.0 /100 | #326 | Tragic 28.3% |
| Paiute | 0.0 /100 | #327 | Tragic 28.1% |
| Crow | 0.0 /100 | #328 | Tragic 27.7% |
| Immigrants | Central America | 0.0 /100 | #329 | Tragic 27.5% |
| Spanish American Indians | 0.0 /100 | #330 | Tragic 27.5% |
| Immigrants | Azores | 0.0 /100 | #331 | Tragic 27.3% |
| Menominee | 0.0 /100 | #332 | Tragic 27.3% |
| Mexicans | 0.0 /100 | #333 | Tragic 27.1% |
| Arapaho | 0.0 /100 | #334 | Tragic 26.6% |
| Natives/Alaskans | 0.0 /100 | #335 | Tragic 26.3% |