Immigrants from Liberia vs Immigrants from Yemen Male Unemployment
COMPARE
Immigrants from Liberia
Immigrants from Yemen
Male Unemployment
Male Unemployment Comparison
Immigrants from Liberia
Immigrants from Yemen
6.1%
MALE UNEMPLOYMENT
0.0/ 100
METRIC RATING
277th/ 347
METRIC RANK
7.8%
MALE UNEMPLOYMENT
0.0/ 100
METRIC RATING
329th/ 347
METRIC RANK
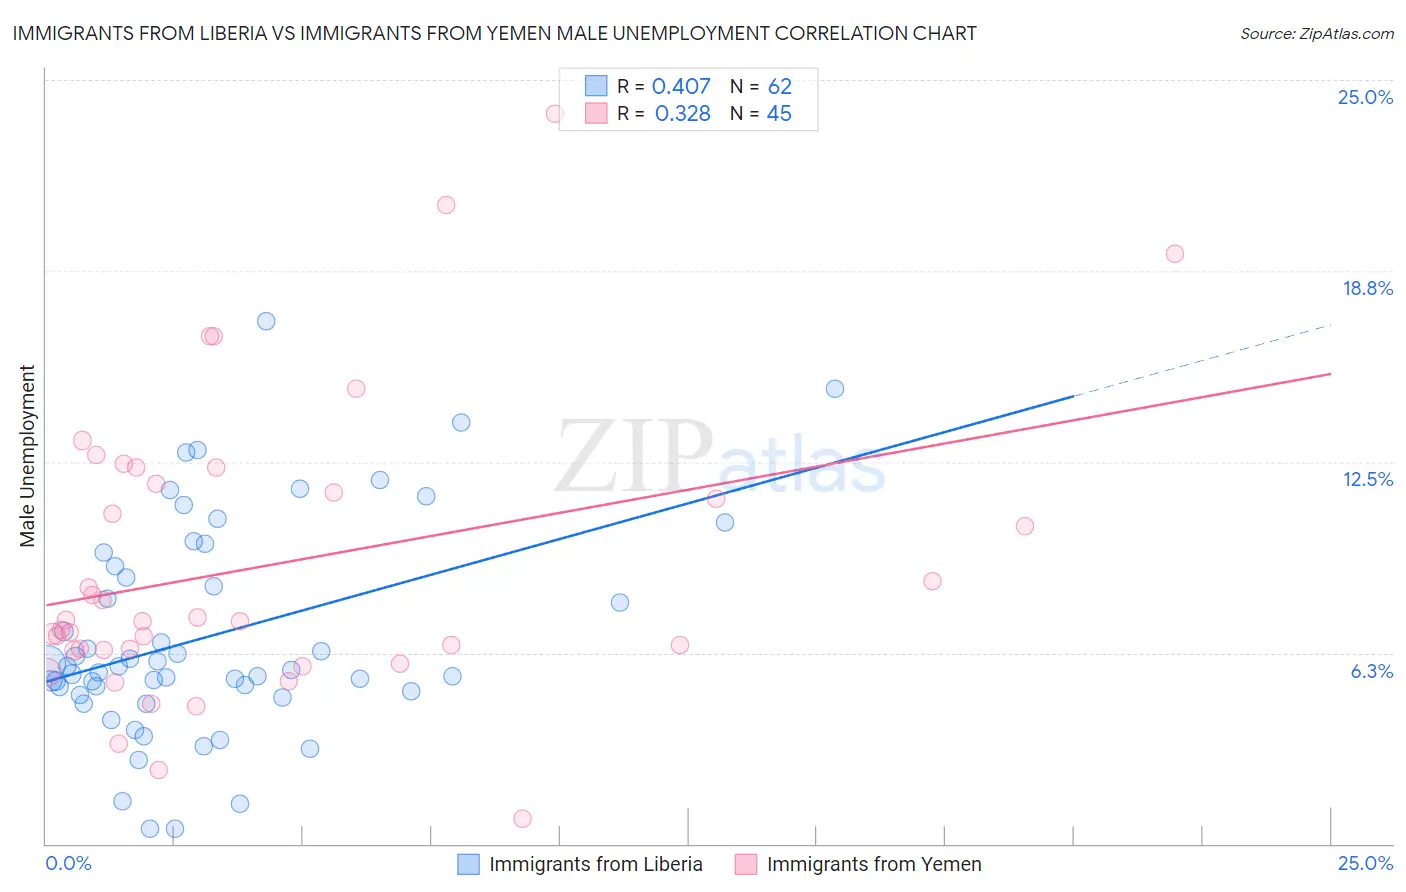
Immigrants from Liberia vs Immigrants from Yemen Male Unemployment Correlation Chart
The statistical analysis conducted on geographies consisting of 135,135,220 people shows a moderate positive correlation between the proportion of Immigrants from Liberia and unemployment rate among males in the United States with a correlation coefficient (R) of 0.407 and weighted average of 6.1%. Similarly, the statistical analysis conducted on geographies consisting of 82,399,512 people shows a mild positive correlation between the proportion of Immigrants from Yemen and unemployment rate among males in the United States with a correlation coefficient (R) of 0.328 and weighted average of 7.8%, a difference of 28.6%.
Male Unemployment Correlation Summary
| Measurement | Immigrants from Liberia | Immigrants from Yemen |
| Minimum | 0.50% | 0.80% |
| Maximum | 17.1% | 23.9% |
| Range | 16.6% | 23.1% |
| Mean | 6.8% | 9.1% |
| Median | 5.8% | 7.3% |
| Interquartile 25% (IQ1) | 5.0% | 6.3% |
| Interquartile 75% (IQ3) | 9.1% | 12.1% |
| Interquartile Range (IQR) | 4.1% | 5.7% |
| Standard Deviation (Sample) | 3.5% | 4.8% |
| Standard Deviation (Population) | 3.5% | 4.8% |
Similar Demographics by Male Unemployment
Demographics Similar to Immigrants from Liberia by Male Unemployment
In terms of male unemployment, the demographic groups most similar to Immigrants from Liberia are Immigrants from Fiji (6.1%, a difference of 0.12%), Tlingit-Haida (6.0%, a difference of 0.42%), Menominee (6.0%, a difference of 0.52%), Ghanaian (6.1%, a difference of 0.62%), and Immigrants from Sierra Leone (6.0%, a difference of 0.68%).
| Demographics | Rating | Rank | Male Unemployment |
| Sub-Saharan Africans | 0.0 /100 | #270 | Tragic 6.0% |
| Blackfeet | 0.0 /100 | #271 | Tragic 6.0% |
| Immigrants | Uzbekistan | 0.0 /100 | #272 | Tragic 6.0% |
| Armenians | 0.0 /100 | #273 | Tragic 6.0% |
| Immigrants | Sierra Leone | 0.0 /100 | #274 | Tragic 6.0% |
| Menominee | 0.0 /100 | #275 | Tragic 6.0% |
| Tlingit-Haida | 0.0 /100 | #276 | Tragic 6.0% |
| Immigrants | Liberia | 0.0 /100 | #277 | Tragic 6.1% |
| Immigrants | Fiji | 0.0 /100 | #278 | Tragic 6.1% |
| Ghanaians | 0.0 /100 | #279 | Tragic 6.1% |
| Immigrants | Ghana | 0.0 /100 | #280 | Tragic 6.2% |
| Sierra Leoneans | 0.0 /100 | #281 | Tragic 6.2% |
| Ecuadorians | 0.0 /100 | #282 | Tragic 6.2% |
| Immigrants | Western Africa | 0.0 /100 | #283 | Tragic 6.2% |
| Spanish American Indians | 0.0 /100 | #284 | Tragic 6.2% |
Demographics Similar to Immigrants from Yemen by Male Unemployment
In terms of male unemployment, the demographic groups most similar to Immigrants from Yemen are Native/Alaskan (7.7%, a difference of 0.90%), Paiute (7.7%, a difference of 1.3%), Yakama (7.9%, a difference of 1.8%), Immigrants from Dominican Republic (7.6%, a difference of 2.4%), and Shoshone (7.6%, a difference of 2.5%).
| Demographics | Rating | Rank | Male Unemployment |
| Immigrants | Cabo Verde | 0.0 /100 | #322 | Tragic 7.5% |
| Immigrants | Grenada | 0.0 /100 | #323 | Tragic 7.6% |
| Dominicans | 0.0 /100 | #324 | Tragic 7.6% |
| Shoshone | 0.0 /100 | #325 | Tragic 7.6% |
| Immigrants | Dominican Republic | 0.0 /100 | #326 | Tragic 7.6% |
| Paiute | 0.0 /100 | #327 | Tragic 7.7% |
| Natives/Alaskans | 0.0 /100 | #328 | Tragic 7.7% |
| Immigrants | Yemen | 0.0 /100 | #329 | Tragic 7.8% |
| Yakama | 0.0 /100 | #330 | Tragic 7.9% |
| Alaska Natives | 0.0 /100 | #331 | Tragic 8.1% |
| Pima | 0.0 /100 | #332 | Tragic 8.3% |
| Sioux | 0.0 /100 | #333 | Tragic 8.4% |
| Tsimshian | 0.0 /100 | #334 | Tragic 8.5% |
| Pueblo | 0.0 /100 | #335 | Tragic 8.5% |
| Yuman | 0.0 /100 | #336 | Tragic 8.6% |