Immigrants from Liberia vs Canadian 4 or more Vehicles in Household
COMPARE
Immigrants from Liberia
Canadian
4 or more Vehicles in Household
4 or more Vehicles in Household Comparison
Immigrants from Liberia
Canadians
5.4%
4 OR MORE VEHICLES IN HOUSEHOLD
0.2/ 100
METRIC RATING
285th/ 347
METRIC RANK
6.9%
4 OR MORE VEHICLES IN HOUSEHOLD
96.4/ 100
METRIC RATING
113th/ 347
METRIC RANK
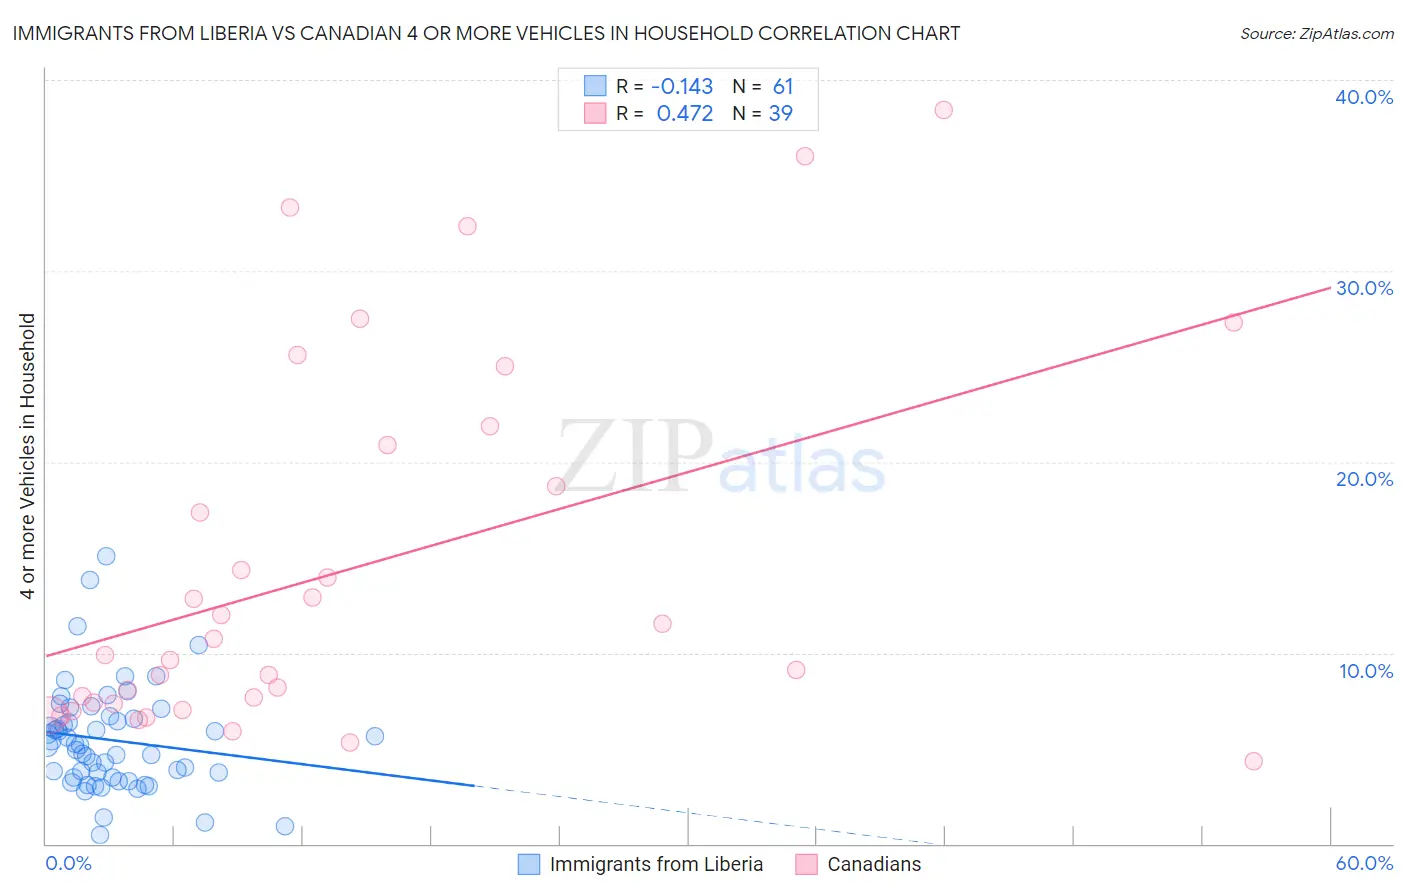
Immigrants from Liberia vs Canadian 4 or more Vehicles in Household Correlation Chart
The statistical analysis conducted on geographies consisting of 135,033,843 people shows a poor negative correlation between the proportion of Immigrants from Liberia and percentage of households with 4 or more vehicles available in the United States with a correlation coefficient (R) of -0.143 and weighted average of 5.4%. Similarly, the statistical analysis conducted on geographies consisting of 435,609,846 people shows a moderate positive correlation between the proportion of Canadians and percentage of households with 4 or more vehicles available in the United States with a correlation coefficient (R) of 0.472 and weighted average of 6.9%, a difference of 27.9%.
4 or more Vehicles in Household Correlation Summary
| Measurement | Immigrants from Liberia | Canadian |
| Minimum | 0.43% | 4.3% |
| Maximum | 15.1% | 38.5% |
| Range | 14.6% | 34.1% |
| Mean | 5.4% | 14.4% |
| Median | 5.2% | 9.9% |
| Interquartile 25% (IQ1) | 3.5% | 7.3% |
| Interquartile 75% (IQ3) | 6.6% | 20.9% |
| Interquartile Range (IQR) | 3.1% | 13.6% |
| Standard Deviation (Sample) | 2.8% | 9.6% |
| Standard Deviation (Population) | 2.7% | 9.4% |
Similar Demographics by 4 or more Vehicles in Household
Demographics Similar to Immigrants from Liberia by 4 or more Vehicles in Household
In terms of 4 or more vehicles in household, the demographic groups most similar to Immigrants from Liberia are Immigrants from Colombia (5.4%, a difference of 0.040%), Immigrants from Croatia (5.4%, a difference of 0.13%), Venezuelan (5.3%, a difference of 0.32%), Brazilian (5.4%, a difference of 0.34%), and Immigrants from Bosnia and Herzegovina (5.3%, a difference of 0.46%).
| Demographics | Rating | Rank | 4 or more Vehicles in Household |
| Immigrants | Eastern Europe | 0.4 /100 | #278 | Tragic 5.4% |
| Immigrants | Uruguay | 0.3 /100 | #279 | Tragic 5.4% |
| Alsatians | 0.3 /100 | #280 | Tragic 5.4% |
| Immigrants | Western Africa | 0.3 /100 | #281 | Tragic 5.4% |
| Immigrants | Spain | 0.3 /100 | #282 | Tragic 5.4% |
| Immigrants | Ireland | 0.3 /100 | #283 | Tragic 5.4% |
| Brazilians | 0.3 /100 | #284 | Tragic 5.4% |
| Immigrants | Liberia | 0.2 /100 | #285 | Tragic 5.4% |
| Immigrants | Colombia | 0.2 /100 | #286 | Tragic 5.4% |
| Immigrants | Croatia | 0.2 /100 | #287 | Tragic 5.4% |
| Venezuelans | 0.2 /100 | #288 | Tragic 5.3% |
| Immigrants | Bosnia and Herzegovina | 0.2 /100 | #289 | Tragic 5.3% |
| Immigrants | Russia | 0.2 /100 | #290 | Tragic 5.3% |
| Immigrants | Bahamas | 0.1 /100 | #291 | Tragic 5.3% |
| Liberians | 0.1 /100 | #292 | Tragic 5.3% |
Demographics Similar to Canadians by 4 or more Vehicles in Household
In terms of 4 or more vehicles in household, the demographic groups most similar to Canadians are Bolivian (6.8%, a difference of 0.050%), Tlingit-Haida (6.8%, a difference of 0.11%), Immigrants from Guatemala (6.8%, a difference of 0.37%), Burmese (6.8%, a difference of 0.40%), and French American Indian (6.8%, a difference of 0.40%).
| Demographics | Rating | Rank | 4 or more Vehicles in Household |
| Guatemalans | 98.1 /100 | #106 | Exceptional 7.0% |
| Nicaraguans | 98.0 /100 | #107 | Exceptional 7.0% |
| French | 97.7 /100 | #108 | Exceptional 6.9% |
| Filipinos | 97.6 /100 | #109 | Exceptional 6.9% |
| Immigrants | Thailand | 97.0 /100 | #110 | Exceptional 6.9% |
| Aleuts | 97.0 /100 | #111 | Exceptional 6.9% |
| Hopi | 97.0 /100 | #112 | Exceptional 6.9% |
| Canadians | 96.4 /100 | #113 | Exceptional 6.9% |
| Bolivians | 96.3 /100 | #114 | Exceptional 6.8% |
| Tlingit-Haida | 96.2 /100 | #115 | Exceptional 6.8% |
| Immigrants | Guatemala | 95.8 /100 | #116 | Exceptional 6.8% |
| Burmese | 95.7 /100 | #117 | Exceptional 6.8% |
| French American Indians | 95.7 /100 | #118 | Exceptional 6.8% |
| Costa Ricans | 95.5 /100 | #119 | Exceptional 6.8% |
| Comanche | 94.8 /100 | #120 | Exceptional 6.8% |