Immigrants from Liberia vs Peruvian 4 or more Vehicles in Household
COMPARE
Immigrants from Liberia
Peruvian
4 or more Vehicles in Household
4 or more Vehicles in Household Comparison
Immigrants from Liberia
Peruvians
5.4%
4 OR MORE VEHICLES IN HOUSEHOLD
0.2/ 100
METRIC RATING
285th/ 347
METRIC RANK
6.5%
4 OR MORE VEHICLES IN HOUSEHOLD
69.4/ 100
METRIC RATING
157th/ 347
METRIC RANK
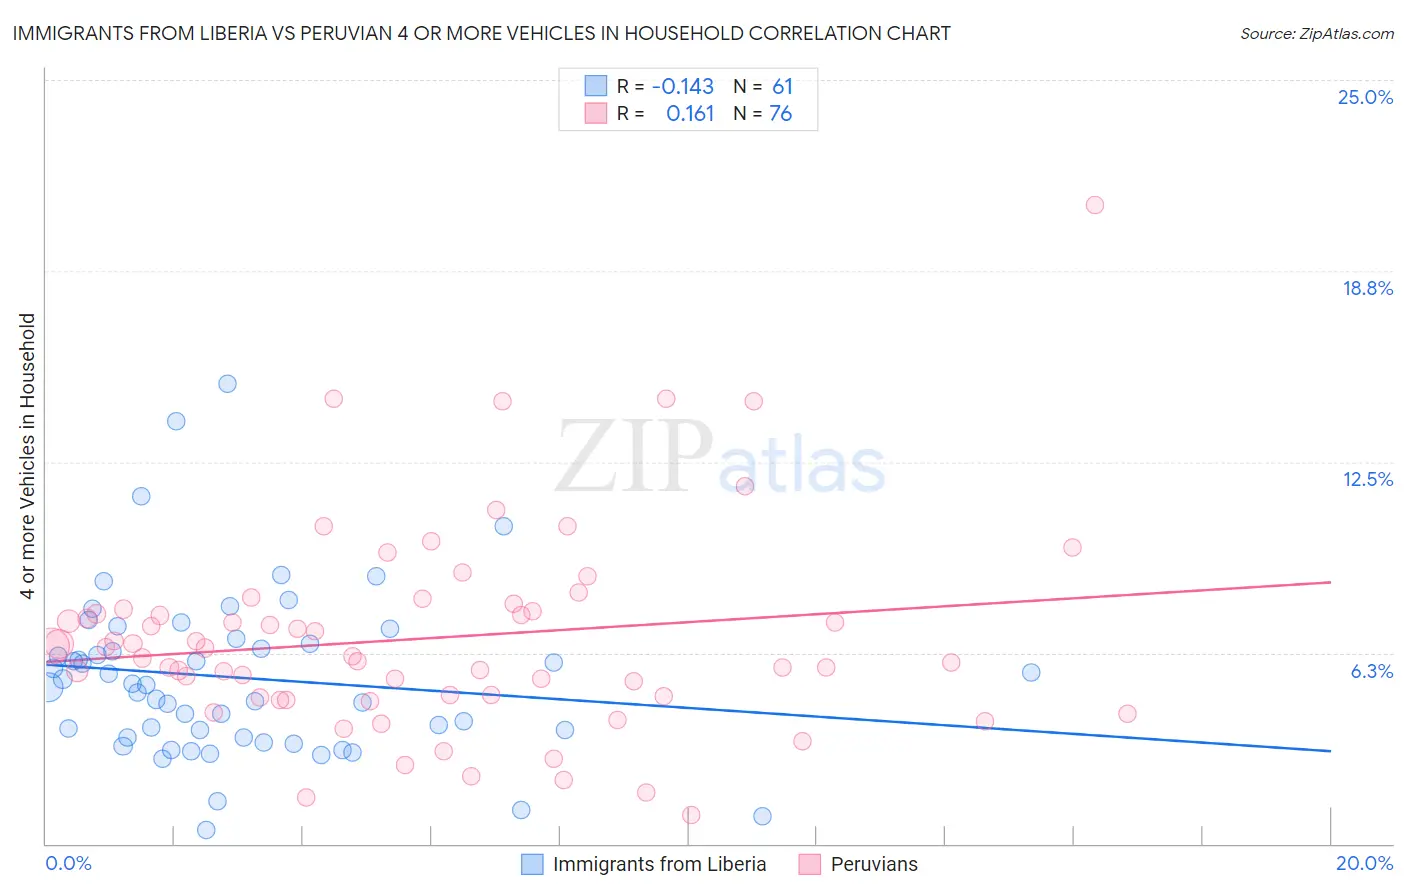
Immigrants from Liberia vs Peruvian 4 or more Vehicles in Household Correlation Chart
The statistical analysis conducted on geographies consisting of 135,033,843 people shows a poor negative correlation between the proportion of Immigrants from Liberia and percentage of households with 4 or more vehicles available in the United States with a correlation coefficient (R) of -0.143 and weighted average of 5.4%. Similarly, the statistical analysis conducted on geographies consisting of 361,410,138 people shows a poor positive correlation between the proportion of Peruvians and percentage of households with 4 or more vehicles available in the United States with a correlation coefficient (R) of 0.161 and weighted average of 6.5%, a difference of 20.5%.
4 or more Vehicles in Household Correlation Summary
| Measurement | Immigrants from Liberia | Peruvian |
| Minimum | 0.43% | 0.93% |
| Maximum | 15.1% | 20.9% |
| Range | 14.6% | 20.0% |
| Mean | 5.4% | 6.7% |
| Median | 5.2% | 6.3% |
| Interquartile 25% (IQ1) | 3.5% | 4.8% |
| Interquartile 75% (IQ3) | 6.6% | 7.6% |
| Interquartile Range (IQR) | 3.1% | 2.8% |
| Standard Deviation (Sample) | 2.8% | 3.3% |
| Standard Deviation (Population) | 2.7% | 3.3% |
Similar Demographics by 4 or more Vehicles in Household
Demographics Similar to Immigrants from Liberia by 4 or more Vehicles in Household
In terms of 4 or more vehicles in household, the demographic groups most similar to Immigrants from Liberia are Immigrants from Colombia (5.4%, a difference of 0.040%), Immigrants from Croatia (5.4%, a difference of 0.13%), Venezuelan (5.3%, a difference of 0.32%), Brazilian (5.4%, a difference of 0.34%), and Immigrants from Bosnia and Herzegovina (5.3%, a difference of 0.46%).
| Demographics | Rating | Rank | 4 or more Vehicles in Household |
| Immigrants | Eastern Europe | 0.4 /100 | #278 | Tragic 5.4% |
| Immigrants | Uruguay | 0.3 /100 | #279 | Tragic 5.4% |
| Alsatians | 0.3 /100 | #280 | Tragic 5.4% |
| Immigrants | Western Africa | 0.3 /100 | #281 | Tragic 5.4% |
| Immigrants | Spain | 0.3 /100 | #282 | Tragic 5.4% |
| Immigrants | Ireland | 0.3 /100 | #283 | Tragic 5.4% |
| Brazilians | 0.3 /100 | #284 | Tragic 5.4% |
| Immigrants | Liberia | 0.2 /100 | #285 | Tragic 5.4% |
| Immigrants | Colombia | 0.2 /100 | #286 | Tragic 5.4% |
| Immigrants | Croatia | 0.2 /100 | #287 | Tragic 5.4% |
| Venezuelans | 0.2 /100 | #288 | Tragic 5.3% |
| Immigrants | Bosnia and Herzegovina | 0.2 /100 | #289 | Tragic 5.3% |
| Immigrants | Russia | 0.2 /100 | #290 | Tragic 5.3% |
| Immigrants | Bahamas | 0.1 /100 | #291 | Tragic 5.3% |
| Liberians | 0.1 /100 | #292 | Tragic 5.3% |
Demographics Similar to Peruvians by 4 or more Vehicles in Household
In terms of 4 or more vehicles in household, the demographic groups most similar to Peruvians are Iranian (6.5%, a difference of 0.050%), Iroquois (6.5%, a difference of 0.11%), Central American Indian (6.5%, a difference of 0.19%), Immigrants from Armenia (6.5%, a difference of 0.21%), and Zimbabwean (6.4%, a difference of 0.27%).
| Demographics | Rating | Rank | 4 or more Vehicles in Household |
| New Zealanders | 73.3 /100 | #150 | Good 6.5% |
| Immigrants | Hong Kong | 72.2 /100 | #151 | Good 6.5% |
| Yuman | 72.1 /100 | #152 | Good 6.5% |
| Immigrants | Armenia | 71.2 /100 | #153 | Good 6.5% |
| Central American Indians | 71.1 /100 | #154 | Good 6.5% |
| Iroquois | 70.4 /100 | #155 | Good 6.5% |
| Iranians | 69.9 /100 | #156 | Good 6.5% |
| Peruvians | 69.4 /100 | #157 | Good 6.5% |
| Zimbabweans | 67.1 /100 | #158 | Good 6.4% |
| Indians (Asian) | 66.3 /100 | #159 | Good 6.4% |
| Palestinians | 65.8 /100 | #160 | Good 6.4% |
| Immigrants | Cameroon | 64.4 /100 | #161 | Good 6.4% |
| Immigrants | Pakistan | 63.2 /100 | #162 | Good 6.4% |
| Chileans | 61.2 /100 | #163 | Good 6.4% |
| Hungarians | 61.1 /100 | #164 | Good 6.4% |