Immigrants from Liberia vs Immigrants from England 4 or more Vehicles in Household
COMPARE
Immigrants from Liberia
Immigrants from England
4 or more Vehicles in Household
4 or more Vehicles in Household Comparison
Immigrants from Liberia
Immigrants from England
5.4%
4 OR MORE VEHICLES IN HOUSEHOLD
0.2/ 100
METRIC RATING
285th/ 347
METRIC RANK
6.7%
4 OR MORE VEHICLES IN HOUSEHOLD
92.0/ 100
METRIC RATING
129th/ 347
METRIC RANK
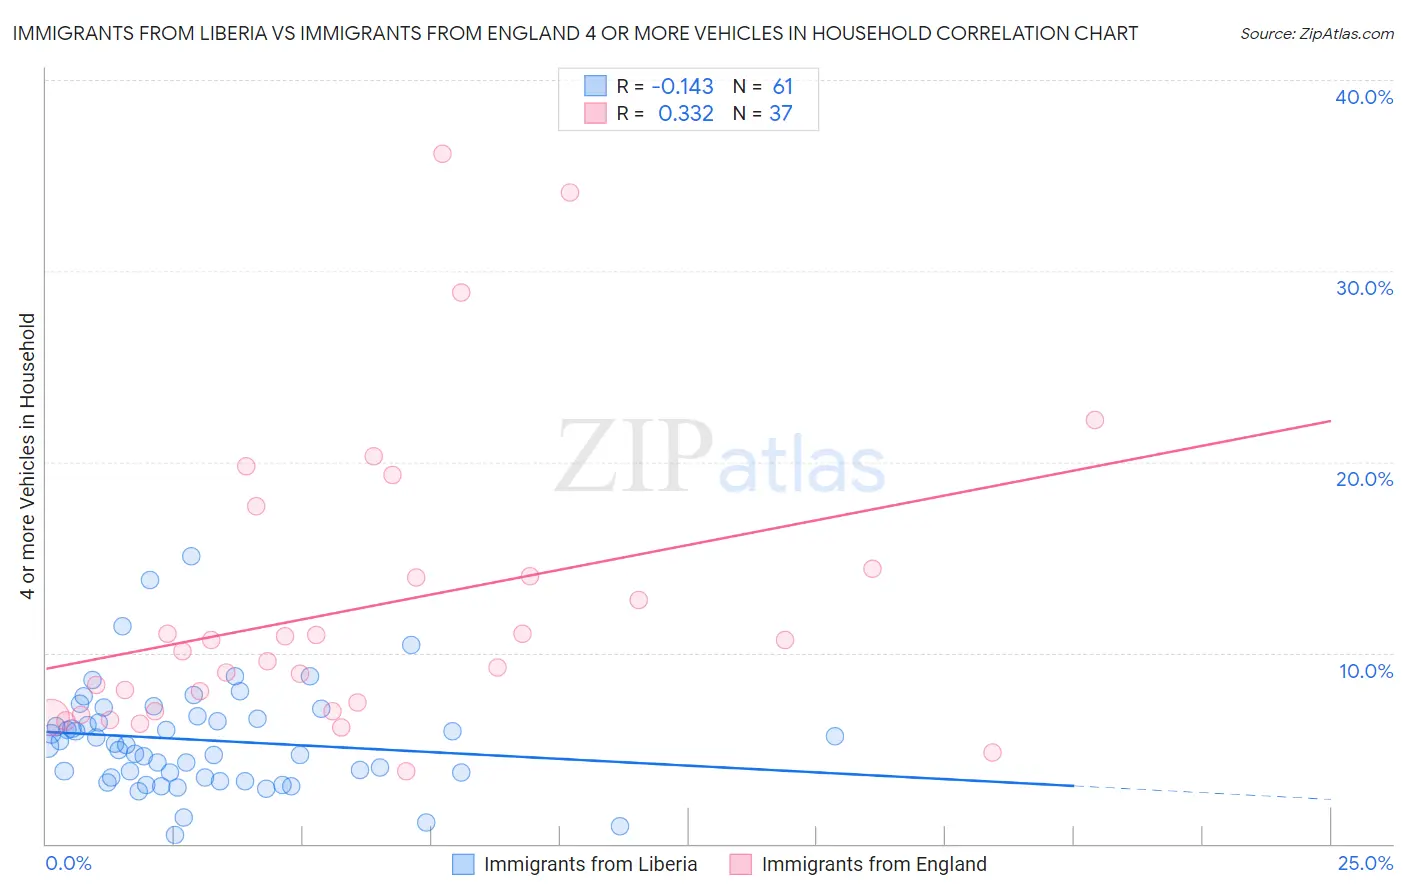
Immigrants from Liberia vs Immigrants from England 4 or more Vehicles in Household Correlation Chart
The statistical analysis conducted on geographies consisting of 135,033,843 people shows a poor negative correlation between the proportion of Immigrants from Liberia and percentage of households with 4 or more vehicles available in the United States with a correlation coefficient (R) of -0.143 and weighted average of 5.4%. Similarly, the statistical analysis conducted on geographies consisting of 390,499,867 people shows a mild positive correlation between the proportion of Immigrants from England and percentage of households with 4 or more vehicles available in the United States with a correlation coefficient (R) of 0.332 and weighted average of 6.7%, a difference of 25.4%.
4 or more Vehicles in Household Correlation Summary
| Measurement | Immigrants from Liberia | Immigrants from England |
| Minimum | 0.43% | 3.8% |
| Maximum | 15.1% | 36.2% |
| Range | 14.6% | 32.3% |
| Mean | 5.4% | 12.4% |
| Median | 5.2% | 10.1% |
| Interquartile 25% (IQ1) | 3.5% | 6.9% |
| Interquartile 75% (IQ3) | 6.6% | 14.2% |
| Interquartile Range (IQR) | 3.1% | 7.3% |
| Standard Deviation (Sample) | 2.8% | 7.7% |
| Standard Deviation (Population) | 2.7% | 7.6% |
Similar Demographics by 4 or more Vehicles in Household
Demographics Similar to Immigrants from Liberia by 4 or more Vehicles in Household
In terms of 4 or more vehicles in household, the demographic groups most similar to Immigrants from Liberia are Immigrants from Colombia (5.4%, a difference of 0.040%), Immigrants from Croatia (5.4%, a difference of 0.13%), Venezuelan (5.3%, a difference of 0.32%), Brazilian (5.4%, a difference of 0.34%), and Immigrants from Bosnia and Herzegovina (5.3%, a difference of 0.46%).
| Demographics | Rating | Rank | 4 or more Vehicles in Household |
| Immigrants | Eastern Europe | 0.4 /100 | #278 | Tragic 5.4% |
| Immigrants | Uruguay | 0.3 /100 | #279 | Tragic 5.4% |
| Alsatians | 0.3 /100 | #280 | Tragic 5.4% |
| Immigrants | Western Africa | 0.3 /100 | #281 | Tragic 5.4% |
| Immigrants | Spain | 0.3 /100 | #282 | Tragic 5.4% |
| Immigrants | Ireland | 0.3 /100 | #283 | Tragic 5.4% |
| Brazilians | 0.3 /100 | #284 | Tragic 5.4% |
| Immigrants | Liberia | 0.2 /100 | #285 | Tragic 5.4% |
| Immigrants | Colombia | 0.2 /100 | #286 | Tragic 5.4% |
| Immigrants | Croatia | 0.2 /100 | #287 | Tragic 5.4% |
| Venezuelans | 0.2 /100 | #288 | Tragic 5.3% |
| Immigrants | Bosnia and Herzegovina | 0.2 /100 | #289 | Tragic 5.3% |
| Immigrants | Russia | 0.2 /100 | #290 | Tragic 5.3% |
| Immigrants | Bahamas | 0.1 /100 | #291 | Tragic 5.3% |
| Liberians | 0.1 /100 | #292 | Tragic 5.3% |
Demographics Similar to Immigrants from England by 4 or more Vehicles in Household
In terms of 4 or more vehicles in household, the demographic groups most similar to Immigrants from England are Immigrants from Bolivia (6.7%, a difference of 0.16%), Immigrants from Korea (6.8%, a difference of 0.66%), Austrian (6.8%, a difference of 0.79%), Belgian (6.8%, a difference of 0.79%), and Immigrants from Scotland (6.7%, a difference of 0.83%).
| Demographics | Rating | Rank | 4 or more Vehicles in Household |
| Immigrants | Nicaragua | 94.7 /100 | #122 | Exceptional 6.8% |
| Immigrants | Immigrants | 94.6 /100 | #123 | Exceptional 6.8% |
| Immigrants | Asia | 94.4 /100 | #124 | Exceptional 6.8% |
| Austrians | 94.1 /100 | #125 | Exceptional 6.8% |
| Belgians | 94.1 /100 | #126 | Exceptional 6.8% |
| Immigrants | Korea | 93.8 /100 | #127 | Exceptional 6.8% |
| Immigrants | Bolivia | 92.5 /100 | #128 | Exceptional 6.7% |
| Immigrants | England | 92.0 /100 | #129 | Exceptional 6.7% |
| Immigrants | Scotland | 89.0 /100 | #130 | Excellent 6.7% |
| Maltese | 88.4 /100 | #131 | Excellent 6.7% |
| Immigrants | Netherlands | 87.8 /100 | #132 | Excellent 6.6% |
| Armenians | 86.9 /100 | #133 | Excellent 6.6% |
| Ottawa | 86.9 /100 | #134 | Excellent 6.6% |
| Tohono O'odham | 86.7 /100 | #135 | Excellent 6.6% |
| Luxembourgers | 86.4 /100 | #136 | Excellent 6.6% |