Luxembourger vs Canadian 4 or more Vehicles in Household
COMPARE
Luxembourger
Canadian
4 or more Vehicles in Household
4 or more Vehicles in Household Comparison
Luxembourgers
Canadians
6.6%
4 OR MORE VEHICLES IN HOUSEHOLD
86.4/ 100
METRIC RATING
136th/ 347
METRIC RANK
6.9%
4 OR MORE VEHICLES IN HOUSEHOLD
96.4/ 100
METRIC RATING
113th/ 347
METRIC RANK
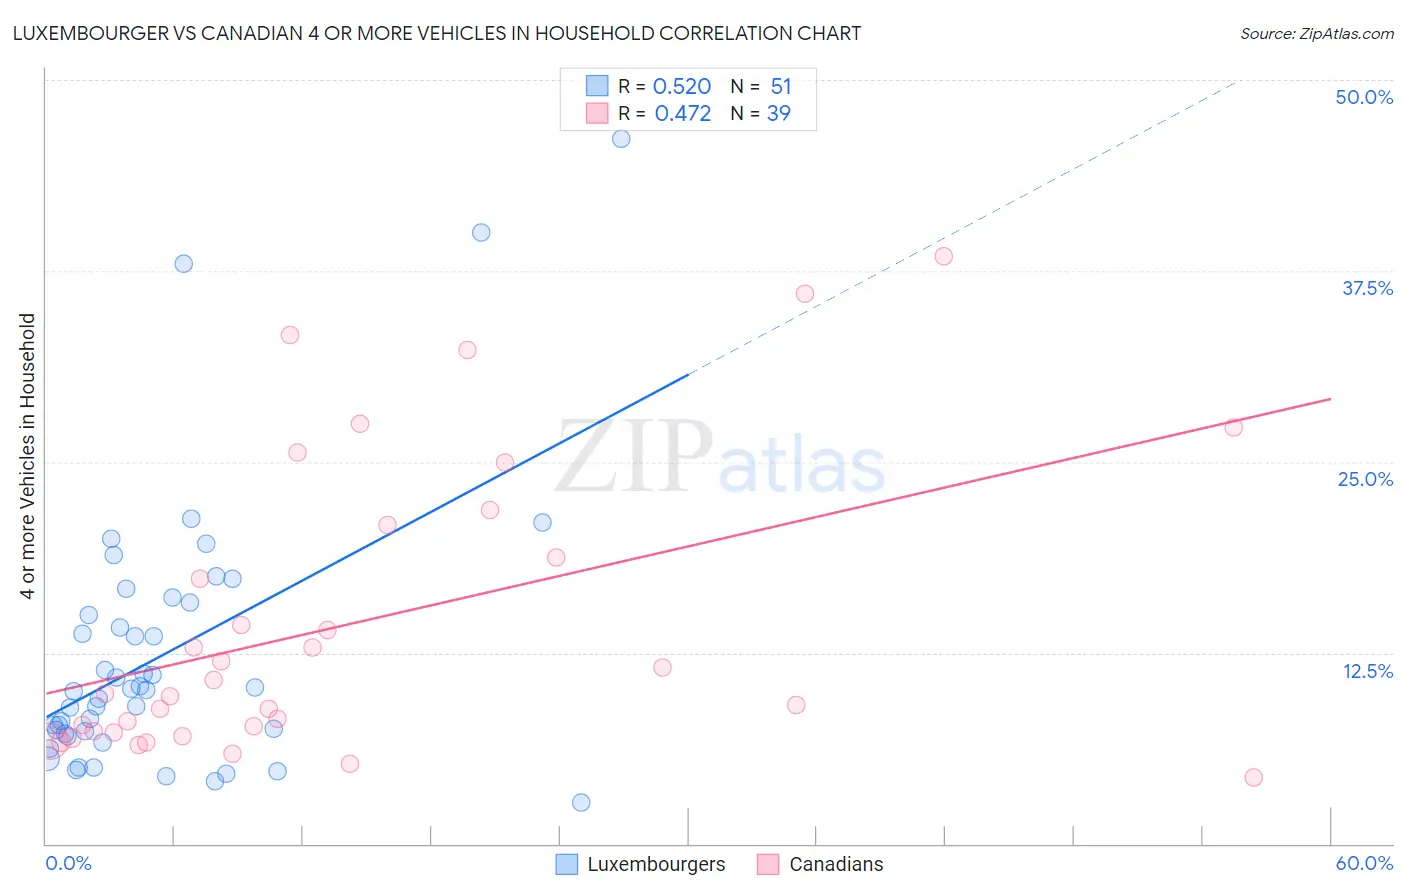
Luxembourger vs Canadian 4 or more Vehicles in Household Correlation Chart
The statistical analysis conducted on geographies consisting of 144,419,010 people shows a substantial positive correlation between the proportion of Luxembourgers and percentage of households with 4 or more vehicles available in the United States with a correlation coefficient (R) of 0.520 and weighted average of 6.6%. Similarly, the statistical analysis conducted on geographies consisting of 435,609,846 people shows a moderate positive correlation between the proportion of Canadians and percentage of households with 4 or more vehicles available in the United States with a correlation coefficient (R) of 0.472 and weighted average of 6.9%, a difference of 3.5%.
4 or more Vehicles in Household Correlation Summary
| Measurement | Luxembourger | Canadian |
| Minimum | 2.7% | 4.3% |
| Maximum | 46.2% | 38.5% |
| Range | 43.5% | 34.1% |
| Mean | 12.4% | 14.4% |
| Median | 10.0% | 9.9% |
| Interquartile 25% (IQ1) | 7.2% | 7.3% |
| Interquartile 75% (IQ3) | 15.8% | 20.9% |
| Interquartile Range (IQR) | 8.6% | 13.6% |
| Standard Deviation (Sample) | 8.8% | 9.6% |
| Standard Deviation (Population) | 8.7% | 9.4% |
Similar Demographics by 4 or more Vehicles in Household
Demographics Similar to Luxembourgers by 4 or more Vehicles in Household
In terms of 4 or more vehicles in household, the demographic groups most similar to Luxembourgers are Tohono O'odham (6.6%, a difference of 0.070%), Ottawa (6.6%, a difference of 0.10%), Armenian (6.6%, a difference of 0.11%), French Canadian (6.6%, a difference of 0.21%), and Immigrants from Netherlands (6.6%, a difference of 0.31%).
| Demographics | Rating | Rank | 4 or more Vehicles in Household |
| Immigrants | England | 92.0 /100 | #129 | Exceptional 6.7% |
| Immigrants | Scotland | 89.0 /100 | #130 | Excellent 6.7% |
| Maltese | 88.4 /100 | #131 | Excellent 6.7% |
| Immigrants | Netherlands | 87.8 /100 | #132 | Excellent 6.6% |
| Armenians | 86.9 /100 | #133 | Excellent 6.6% |
| Ottawa | 86.9 /100 | #134 | Excellent 6.6% |
| Tohono O'odham | 86.7 /100 | #135 | Excellent 6.6% |
| Luxembourgers | 86.4 /100 | #136 | Excellent 6.6% |
| French Canadians | 85.4 /100 | #137 | Excellent 6.6% |
| Italians | 84.5 /100 | #138 | Excellent 6.6% |
| Jordanians | 82.1 /100 | #139 | Excellent 6.6% |
| Slavs | 81.6 /100 | #140 | Excellent 6.6% |
| Australians | 80.8 /100 | #141 | Excellent 6.6% |
| Immigrants | Iraq | 79.4 /100 | #142 | Good 6.5% |
| Immigrants | Canada | 78.6 /100 | #143 | Good 6.5% |
Demographics Similar to Canadians by 4 or more Vehicles in Household
In terms of 4 or more vehicles in household, the demographic groups most similar to Canadians are Bolivian (6.8%, a difference of 0.050%), Tlingit-Haida (6.8%, a difference of 0.11%), Immigrants from Guatemala (6.8%, a difference of 0.37%), Burmese (6.8%, a difference of 0.40%), and French American Indian (6.8%, a difference of 0.40%).
| Demographics | Rating | Rank | 4 or more Vehicles in Household |
| Guatemalans | 98.1 /100 | #106 | Exceptional 7.0% |
| Nicaraguans | 98.0 /100 | #107 | Exceptional 7.0% |
| French | 97.7 /100 | #108 | Exceptional 6.9% |
| Filipinos | 97.6 /100 | #109 | Exceptional 6.9% |
| Immigrants | Thailand | 97.0 /100 | #110 | Exceptional 6.9% |
| Aleuts | 97.0 /100 | #111 | Exceptional 6.9% |
| Hopi | 97.0 /100 | #112 | Exceptional 6.9% |
| Canadians | 96.4 /100 | #113 | Exceptional 6.9% |
| Bolivians | 96.3 /100 | #114 | Exceptional 6.8% |
| Tlingit-Haida | 96.2 /100 | #115 | Exceptional 6.8% |
| Immigrants | Guatemala | 95.8 /100 | #116 | Exceptional 6.8% |
| Burmese | 95.7 /100 | #117 | Exceptional 6.8% |
| French American Indians | 95.7 /100 | #118 | Exceptional 6.8% |
| Costa Ricans | 95.5 /100 | #119 | Exceptional 6.8% |
| Comanche | 94.8 /100 | #120 | Exceptional 6.8% |