Immigrants from Liberia vs Canadian Master's Degree
COMPARE
Immigrants from Liberia
Canadian
Master's Degree
Master's Degree Comparison
Immigrants from Liberia
Canadians
12.5%
MASTER'S DEGREE
0.6/ 100
METRIC RATING
258th/ 347
METRIC RANK
15.7%
MASTER'S DEGREE
83.3/ 100
METRIC RATING
144th/ 347
METRIC RANK
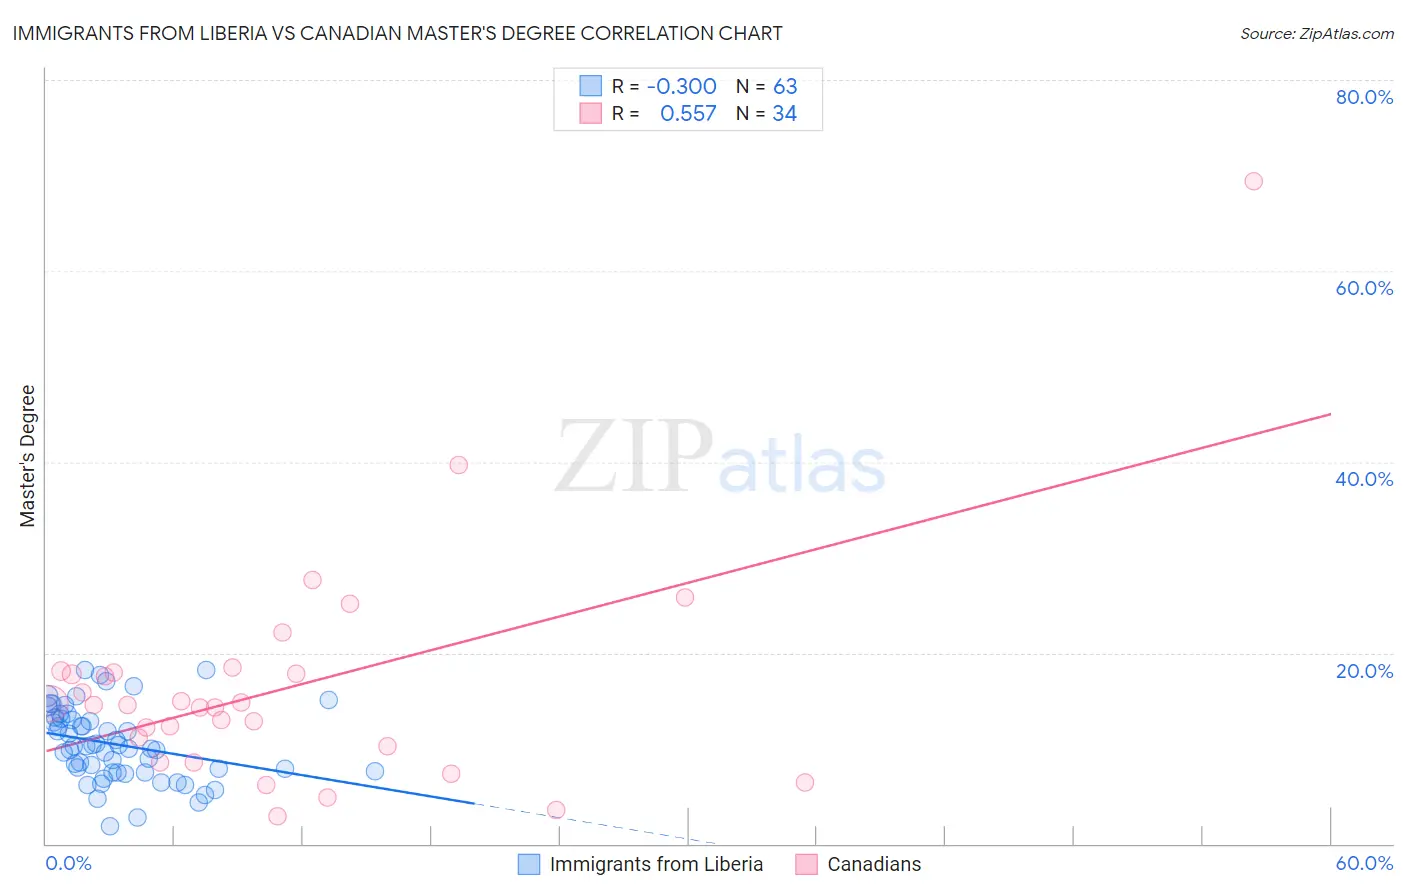
Immigrants from Liberia vs Canadian Master's Degree Correlation Chart
The statistical analysis conducted on geographies consisting of 135,237,477 people shows a weak negative correlation between the proportion of Immigrants from Liberia and percentage of population with at least master's degree education in the United States with a correlation coefficient (R) of -0.300 and weighted average of 12.5%. Similarly, the statistical analysis conducted on geographies consisting of 437,396,402 people shows a substantial positive correlation between the proportion of Canadians and percentage of population with at least master's degree education in the United States with a correlation coefficient (R) of 0.557 and weighted average of 15.7%, a difference of 25.4%.
Master's Degree Correlation Summary
| Measurement | Immigrants from Liberia | Canadian |
| Minimum | 1.9% | 2.8% |
| Maximum | 18.2% | 69.4% |
| Range | 16.4% | 66.6% |
| Mean | 10.4% | 16.3% |
| Median | 10.2% | 14.6% |
| Interquartile 25% (IQ1) | 7.5% | 10.2% |
| Interquartile 75% (IQ3) | 13.0% | 18.0% |
| Interquartile Range (IQR) | 5.6% | 7.8% |
| Standard Deviation (Sample) | 3.8% | 12.0% |
| Standard Deviation (Population) | 3.8% | 11.8% |
Similar Demographics by Master's Degree
Demographics Similar to Immigrants from Liberia by Master's Degree
In terms of master's degree, the demographic groups most similar to Immigrants from Liberia are Japanese (12.5%, a difference of 0.090%), Dominican (12.5%, a difference of 0.10%), Tongan (12.5%, a difference of 0.13%), Nicaraguan (12.5%, a difference of 0.32%), and Osage (12.6%, a difference of 0.50%).
| Demographics | Rating | Rank | Master's Degree |
| Tlingit-Haida | 1.3 /100 | #251 | Tragic 12.8% |
| French American Indians | 1.0 /100 | #252 | Tragic 12.7% |
| Immigrants | Dominica | 0.8 /100 | #253 | Tragic 12.6% |
| Indonesians | 0.8 /100 | #254 | Tragic 12.6% |
| Immigrants | Congo | 0.8 /100 | #255 | Tragic 12.6% |
| Immigrants | Portugal | 0.8 /100 | #256 | Tragic 12.6% |
| Osage | 0.7 /100 | #257 | Tragic 12.6% |
| Immigrants | Liberia | 0.6 /100 | #258 | Tragic 12.5% |
| Japanese | 0.6 /100 | #259 | Tragic 12.5% |
| Dominicans | 0.6 /100 | #260 | Tragic 12.5% |
| Tongans | 0.6 /100 | #261 | Tragic 12.5% |
| Nicaraguans | 0.6 /100 | #262 | Tragic 12.5% |
| Central American Indians | 0.5 /100 | #263 | Tragic 12.4% |
| Belizeans | 0.5 /100 | #264 | Tragic 12.4% |
| Immigrants | Fiji | 0.5 /100 | #265 | Tragic 12.4% |
Demographics Similar to Canadians by Master's Degree
In terms of master's degree, the demographic groups most similar to Canadians are Immigrants from Venezuela (15.7%, a difference of 0.080%), Immigrants from Africa (15.7%, a difference of 0.17%), Polish (15.7%, a difference of 0.40%), South American (15.6%, a difference of 0.42%), and Vietnamese (15.8%, a difference of 0.53%).
| Demographics | Rating | Rank | Master's Degree |
| Europeans | 86.4 /100 | #137 | Excellent 15.8% |
| Pakistanis | 86.1 /100 | #138 | Excellent 15.8% |
| Immigrants | Germany | 85.9 /100 | #139 | Excellent 15.8% |
| Vietnamese | 85.5 /100 | #140 | Excellent 15.8% |
| Poles | 85.0 /100 | #141 | Excellent 15.7% |
| Immigrants | Africa | 84.0 /100 | #142 | Excellent 15.7% |
| Immigrants | Venezuela | 83.6 /100 | #143 | Excellent 15.7% |
| Canadians | 83.3 /100 | #144 | Excellent 15.7% |
| South Americans | 81.3 /100 | #145 | Excellent 15.6% |
| Immigrants | Afghanistan | 79.4 /100 | #146 | Good 15.6% |
| Hungarians | 79.1 /100 | #147 | Good 15.6% |
| Immigrants | Senegal | 78.2 /100 | #148 | Good 15.5% |
| Ghanaians | 78.2 /100 | #149 | Good 15.5% |
| Slovenes | 78.0 /100 | #150 | Good 15.5% |
| Iraqis | 77.3 /100 | #151 | Good 15.5% |