Zimbabwean vs Apache 4 or more Vehicles in Household
COMPARE
Zimbabwean
Apache
4 or more Vehicles in Household
4 or more Vehicles in Household Comparison
Zimbabweans
Apache
6.4%
4 OR MORE VEHICLES IN HOUSEHOLD
67.1/ 100
METRIC RATING
158th/ 347
METRIC RANK
7.4%
4 OR MORE VEHICLES IN HOUSEHOLD
99.9/ 100
METRIC RATING
77th/ 347
METRIC RANK
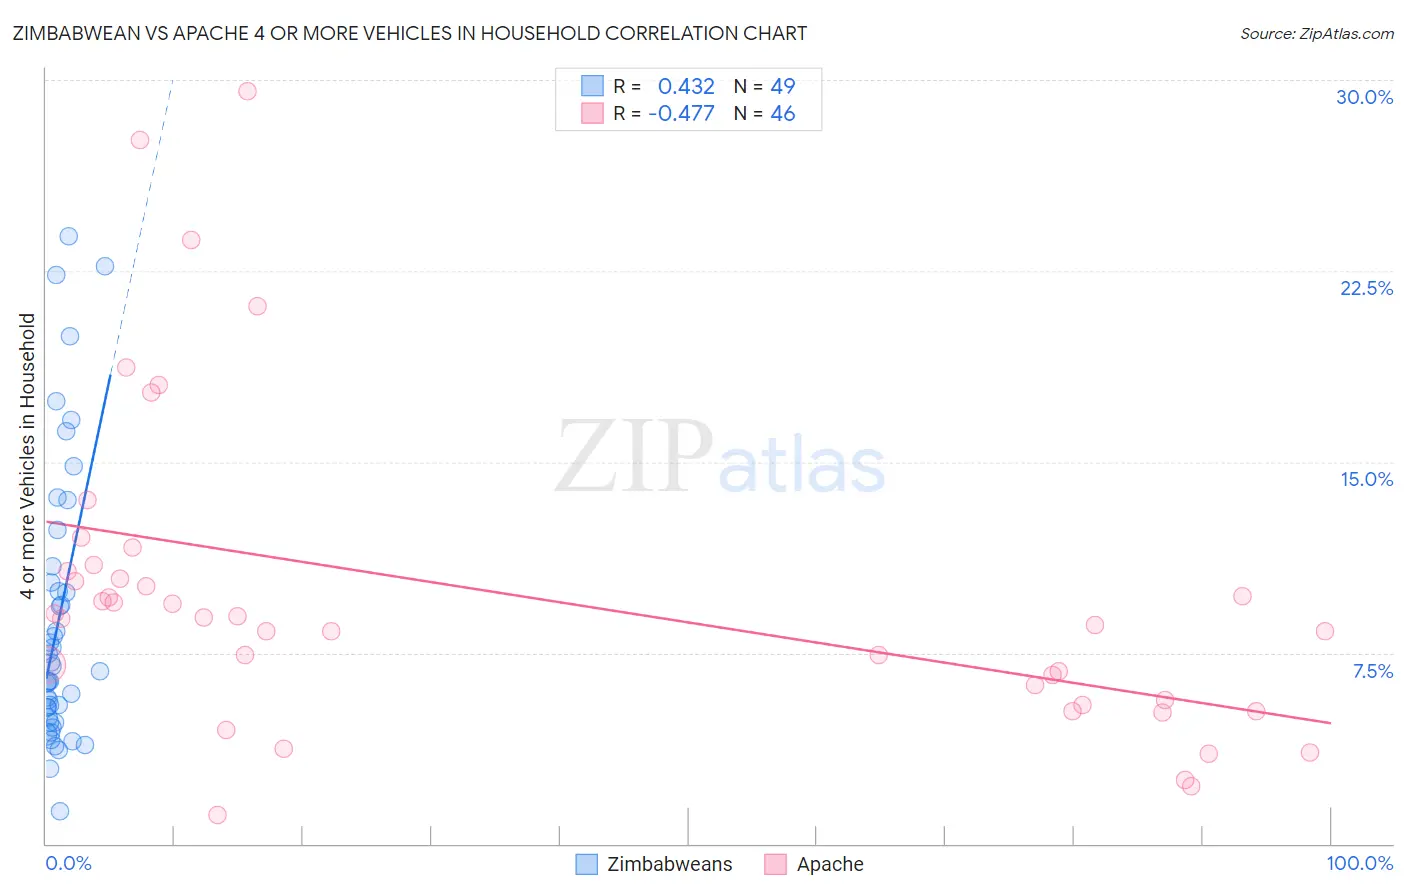
Zimbabwean vs Apache 4 or more Vehicles in Household Correlation Chart
The statistical analysis conducted on geographies consisting of 69,013,822 people shows a moderate positive correlation between the proportion of Zimbabweans and percentage of households with 4 or more vehicles available in the United States with a correlation coefficient (R) of 0.432 and weighted average of 6.4%. Similarly, the statistical analysis conducted on geographies consisting of 230,812,683 people shows a moderate negative correlation between the proportion of Apache and percentage of households with 4 or more vehicles available in the United States with a correlation coefficient (R) of -0.477 and weighted average of 7.4%, a difference of 14.4%.
4 or more Vehicles in Household Correlation Summary
| Measurement | Zimbabwean | Apache |
| Minimum | 1.3% | 1.1% |
| Maximum | 23.8% | 29.6% |
| Range | 22.6% | 28.5% |
| Mean | 8.8% | 9.8% |
| Median | 6.8% | 8.9% |
| Interquartile 25% (IQ1) | 4.9% | 5.6% |
| Interquartile 75% (IQ3) | 10.6% | 10.7% |
| Interquartile Range (IQR) | 5.7% | 5.1% |
| Standard Deviation (Sample) | 5.5% | 6.2% |
| Standard Deviation (Population) | 5.4% | 6.2% |
Similar Demographics by 4 or more Vehicles in Household
Demographics Similar to Zimbabweans by 4 or more Vehicles in Household
In terms of 4 or more vehicles in household, the demographic groups most similar to Zimbabweans are Indian (Asian) (6.4%, a difference of 0.090%), Palestinian (6.4%, a difference of 0.15%), Peruvian (6.5%, a difference of 0.27%), Immigrants from Cameroon (6.4%, a difference of 0.30%), and Iranian (6.5%, a difference of 0.32%).
| Demographics | Rating | Rank | 4 or more Vehicles in Household |
| Immigrants | Hong Kong | 72.2 /100 | #151 | Good 6.5% |
| Yuman | 72.1 /100 | #152 | Good 6.5% |
| Immigrants | Armenia | 71.2 /100 | #153 | Good 6.5% |
| Central American Indians | 71.1 /100 | #154 | Good 6.5% |
| Iroquois | 70.4 /100 | #155 | Good 6.5% |
| Iranians | 69.9 /100 | #156 | Good 6.5% |
| Peruvians | 69.4 /100 | #157 | Good 6.5% |
| Zimbabweans | 67.1 /100 | #158 | Good 6.4% |
| Indians (Asian) | 66.3 /100 | #159 | Good 6.4% |
| Palestinians | 65.8 /100 | #160 | Good 6.4% |
| Immigrants | Cameroon | 64.4 /100 | #161 | Good 6.4% |
| Immigrants | Pakistan | 63.2 /100 | #162 | Good 6.4% |
| Chileans | 61.2 /100 | #163 | Good 6.4% |
| Hungarians | 61.1 /100 | #164 | Good 6.4% |
| Immigrants | Peru | 59.8 /100 | #165 | Average 6.4% |
Demographics Similar to Apache by 4 or more Vehicles in Household
In terms of 4 or more vehicles in household, the demographic groups most similar to Apache are White/Caucasian (7.4%, a difference of 0.060%), Laotian (7.4%, a difference of 0.17%), Icelander (7.4%, a difference of 0.22%), Immigrants from Cambodia (7.4%, a difference of 0.22%), and Czech (7.4%, a difference of 0.24%).
| Demographics | Rating | Rank | 4 or more Vehicles in Household |
| Scottish | 99.9 /100 | #70 | Exceptional 7.4% |
| Chickasaw | 99.9 /100 | #71 | Exceptional 7.4% |
| Scotch-Irish | 99.9 /100 | #72 | Exceptional 7.4% |
| Portuguese | 99.9 /100 | #73 | Exceptional 7.4% |
| Icelanders | 99.9 /100 | #74 | Exceptional 7.4% |
| Immigrants | Cambodia | 99.9 /100 | #75 | Exceptional 7.4% |
| Laotians | 99.9 /100 | #76 | Exceptional 7.4% |
| Apache | 99.9 /100 | #77 | Exceptional 7.4% |
| Whites/Caucasians | 99.8 /100 | #78 | Exceptional 7.4% |
| Czechs | 99.8 /100 | #79 | Exceptional 7.4% |
| Alaska Natives | 99.8 /100 | #80 | Exceptional 7.3% |
| Finns | 99.8 /100 | #81 | Exceptional 7.3% |
| Northern Europeans | 99.8 /100 | #82 | Exceptional 7.3% |
| Potawatomi | 99.7 /100 | #83 | Exceptional 7.3% |
| Afghans | 99.7 /100 | #84 | Exceptional 7.3% |