Immigrants from China vs Apache 4 or more Vehicles in Household
COMPARE
Immigrants from China
Apache
4 or more Vehicles in Household
4 or more Vehicles in Household Comparison
Immigrants from China
Apache
6.0%
4 OR MORE VEHICLES IN HOUSEHOLD
13.8/ 100
METRIC RATING
215th/ 347
METRIC RANK
7.4%
4 OR MORE VEHICLES IN HOUSEHOLD
99.9/ 100
METRIC RATING
77th/ 347
METRIC RANK
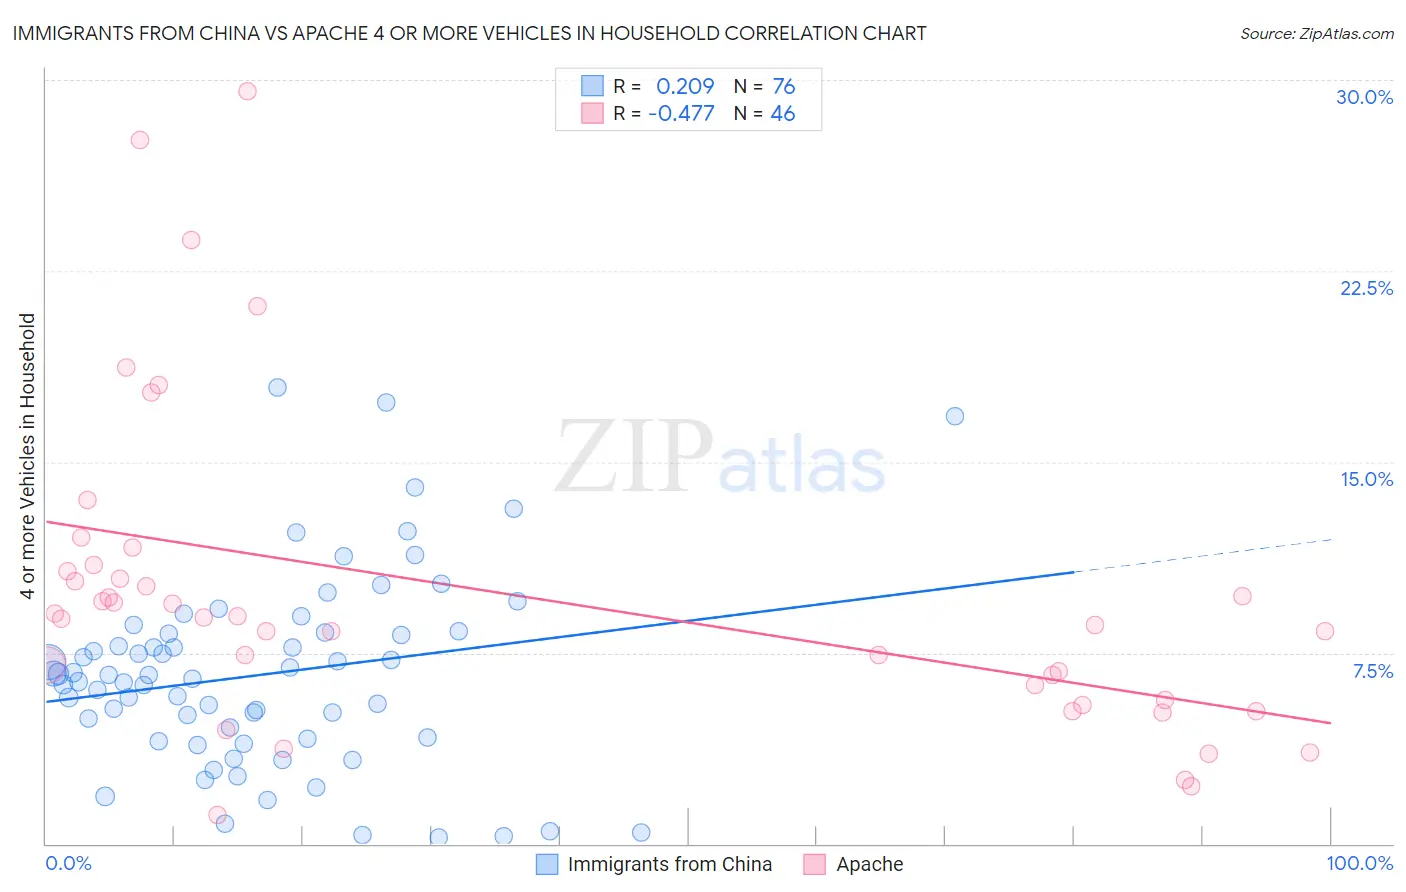
Immigrants from China vs Apache 4 or more Vehicles in Household Correlation Chart
The statistical analysis conducted on geographies consisting of 454,562,757 people shows a weak positive correlation between the proportion of Immigrants from China and percentage of households with 4 or more vehicles available in the United States with a correlation coefficient (R) of 0.209 and weighted average of 6.0%. Similarly, the statistical analysis conducted on geographies consisting of 230,812,683 people shows a moderate negative correlation between the proportion of Apache and percentage of households with 4 or more vehicles available in the United States with a correlation coefficient (R) of -0.477 and weighted average of 7.4%, a difference of 22.2%.
4 or more Vehicles in Household Correlation Summary
| Measurement | Immigrants from China | Apache |
| Minimum | 0.27% | 1.1% |
| Maximum | 17.9% | 29.6% |
| Range | 17.7% | 28.5% |
| Mean | 6.6% | 9.8% |
| Median | 6.6% | 8.9% |
| Interquartile 25% (IQ1) | 4.1% | 5.6% |
| Interquartile 75% (IQ3) | 8.3% | 10.7% |
| Interquartile Range (IQR) | 4.1% | 5.1% |
| Standard Deviation (Sample) | 3.8% | 6.2% |
| Standard Deviation (Population) | 3.8% | 6.2% |
Similar Demographics by 4 or more Vehicles in Household
Demographics Similar to Immigrants from China by 4 or more Vehicles in Household
In terms of 4 or more vehicles in household, the demographic groups most similar to Immigrants from China are Immigrants from Romania (6.0%, a difference of 0.0%), Immigrants from Austria (6.0%, a difference of 0.11%), Arab (6.0%, a difference of 0.13%), Immigrants from Egypt (6.0%, a difference of 0.19%), and Panamanian (6.0%, a difference of 0.20%).
| Demographics | Rating | Rank | 4 or more Vehicles in Household |
| Immigrants | Nigeria | 15.6 /100 | #208 | Poor 6.1% |
| Immigrants | Honduras | 15.4 /100 | #209 | Poor 6.1% |
| Immigrants | Zimbabwe | 15.1 /100 | #210 | Poor 6.0% |
| Panamanians | 14.8 /100 | #211 | Poor 6.0% |
| Immigrants | Egypt | 14.7 /100 | #212 | Poor 6.0% |
| Arabs | 14.4 /100 | #213 | Poor 6.0% |
| Immigrants | Austria | 14.3 /100 | #214 | Poor 6.0% |
| Immigrants | China | 13.8 /100 | #215 | Poor 6.0% |
| Immigrants | Romania | 13.8 /100 | #216 | Poor 6.0% |
| Nigerians | 12.2 /100 | #217 | Poor 6.0% |
| Immigrants | Italy | 11.0 /100 | #218 | Poor 6.0% |
| Serbians | 11.0 /100 | #219 | Poor 6.0% |
| Russians | 10.3 /100 | #220 | Poor 6.0% |
| Immigrants | Moldova | 9.3 /100 | #221 | Tragic 6.0% |
| Cajuns | 9.2 /100 | #222 | Tragic 6.0% |
Demographics Similar to Apache by 4 or more Vehicles in Household
In terms of 4 or more vehicles in household, the demographic groups most similar to Apache are White/Caucasian (7.4%, a difference of 0.060%), Laotian (7.4%, a difference of 0.17%), Icelander (7.4%, a difference of 0.22%), Immigrants from Cambodia (7.4%, a difference of 0.22%), and Czech (7.4%, a difference of 0.24%).
| Demographics | Rating | Rank | 4 or more Vehicles in Household |
| Scottish | 99.9 /100 | #70 | Exceptional 7.4% |
| Chickasaw | 99.9 /100 | #71 | Exceptional 7.4% |
| Scotch-Irish | 99.9 /100 | #72 | Exceptional 7.4% |
| Portuguese | 99.9 /100 | #73 | Exceptional 7.4% |
| Icelanders | 99.9 /100 | #74 | Exceptional 7.4% |
| Immigrants | Cambodia | 99.9 /100 | #75 | Exceptional 7.4% |
| Laotians | 99.9 /100 | #76 | Exceptional 7.4% |
| Apache | 99.9 /100 | #77 | Exceptional 7.4% |
| Whites/Caucasians | 99.8 /100 | #78 | Exceptional 7.4% |
| Czechs | 99.8 /100 | #79 | Exceptional 7.4% |
| Alaska Natives | 99.8 /100 | #80 | Exceptional 7.3% |
| Finns | 99.8 /100 | #81 | Exceptional 7.3% |
| Northern Europeans | 99.8 /100 | #82 | Exceptional 7.3% |
| Potawatomi | 99.7 /100 | #83 | Exceptional 7.3% |
| Afghans | 99.7 /100 | #84 | Exceptional 7.3% |