Immigrants from Kazakhstan vs Immigrants from Ethiopia 2 or more Vehicles in Household
COMPARE
Immigrants from Kazakhstan
Immigrants from Ethiopia
2 or more Vehicles in Household
2 or more Vehicles in Household Comparison
Immigrants from Kazakhstan
Immigrants from Ethiopia
51.6%
2 OR MORE VEHICLES IN HOUSEHOLD
0.1/ 100
METRIC RATING
281st/ 347
METRIC RANK
53.0%
2 OR MORE VEHICLES IN HOUSEHOLD
1.5/ 100
METRIC RATING
245th/ 347
METRIC RANK
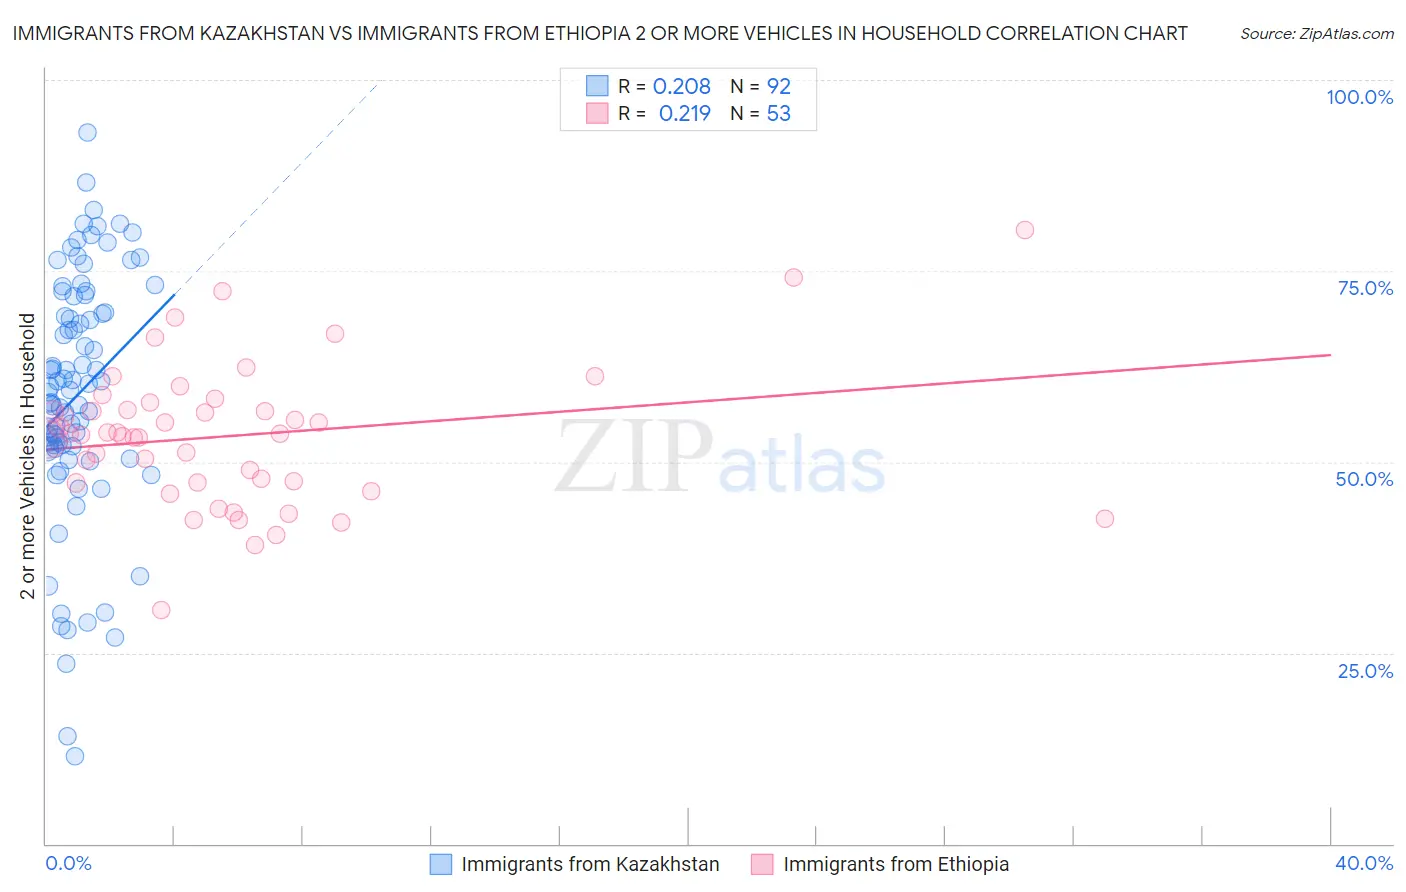
Immigrants from Kazakhstan vs Immigrants from Ethiopia 2 or more Vehicles in Household Correlation Chart
The statistical analysis conducted on geographies consisting of 124,427,212 people shows a weak positive correlation between the proportion of Immigrants from Kazakhstan and percentage of households with 2 or more vehicles available in the United States with a correlation coefficient (R) of 0.208 and weighted average of 51.6%. Similarly, the statistical analysis conducted on geographies consisting of 211,485,366 people shows a weak positive correlation between the proportion of Immigrants from Ethiopia and percentage of households with 2 or more vehicles available in the United States with a correlation coefficient (R) of 0.219 and weighted average of 53.0%, a difference of 2.9%.
2 or more Vehicles in Household Correlation Summary
| Measurement | Immigrants from Kazakhstan | Immigrants from Ethiopia |
| Minimum | 11.5% | 30.6% |
| Maximum | 93.1% | 80.4% |
| Range | 81.6% | 49.7% |
| Mean | 58.8% | 53.4% |
| Median | 59.6% | 53.7% |
| Interquartile 25% (IQ1) | 51.8% | 47.3% |
| Interquartile 75% (IQ3) | 70.7% | 57.3% |
| Interquartile Range (IQR) | 18.8% | 10.0% |
| Standard Deviation (Sample) | 16.2% | 9.3% |
| Standard Deviation (Population) | 16.1% | 9.2% |
Similar Demographics by 2 or more Vehicles in Household
Demographics Similar to Immigrants from Kazakhstan by 2 or more Vehicles in Household
In terms of 2 or more vehicles in household, the demographic groups most similar to Immigrants from Kazakhstan are Bahamian (51.5%, a difference of 0.060%), Immigrants from China (51.5%, a difference of 0.14%), Immigrants from Zaire (51.5%, a difference of 0.18%), Immigrants from Eastern Europe (51.7%, a difference of 0.31%), and Immigrants from Uruguay (51.4%, a difference of 0.34%).
| Demographics | Rating | Rank | 2 or more Vehicles in Household |
| Africans | 0.2 /100 | #274 | Tragic 51.8% |
| Immigrants | Honduras | 0.2 /100 | #275 | Tragic 51.8% |
| Immigrants | Croatia | 0.2 /100 | #276 | Tragic 51.8% |
| Immigrants | Africa | 0.2 /100 | #277 | Tragic 51.8% |
| Yuman | 0.1 /100 | #278 | Tragic 51.7% |
| Liberians | 0.1 /100 | #279 | Tragic 51.7% |
| Immigrants | Eastern Europe | 0.1 /100 | #280 | Tragic 51.7% |
| Immigrants | Kazakhstan | 0.1 /100 | #281 | Tragic 51.6% |
| Bahamians | 0.1 /100 | #282 | Tragic 51.5% |
| Immigrants | China | 0.1 /100 | #283 | Tragic 51.5% |
| Immigrants | Zaire | 0.1 /100 | #284 | Tragic 51.5% |
| Immigrants | Uruguay | 0.1 /100 | #285 | Tragic 51.4% |
| Immigrants | Liberia | 0.1 /100 | #286 | Tragic 51.3% |
| Immigrants | Serbia | 0.1 /100 | #287 | Tragic 51.3% |
| Okinawans | 0.1 /100 | #288 | Tragic 51.2% |
Demographics Similar to Immigrants from Ethiopia by 2 or more Vehicles in Household
In terms of 2 or more vehicles in household, the demographic groups most similar to Immigrants from Ethiopia are Indian (Asian) (53.1%, a difference of 0.12%), Ethiopian (53.1%, a difference of 0.16%), Immigrants from Nigeria (52.9%, a difference of 0.20%), Sierra Leonean (52.9%, a difference of 0.22%), and Immigrants from Eastern Asia (53.2%, a difference of 0.35%).
| Demographics | Rating | Rank | 2 or more Vehicles in Household |
| Immigrants | Armenia | 2.3 /100 | #238 | Tragic 53.3% |
| Cambodians | 2.3 /100 | #239 | Tragic 53.3% |
| Immigrants | Europe | 2.1 /100 | #240 | Tragic 53.2% |
| Immigrants | Sierra Leone | 2.1 /100 | #241 | Tragic 53.2% |
| Immigrants | Eastern Asia | 2.1 /100 | #242 | Tragic 53.2% |
| Ethiopians | 1.7 /100 | #243 | Tragic 53.1% |
| Indians (Asian) | 1.7 /100 | #244 | Tragic 53.1% |
| Immigrants | Ethiopia | 1.5 /100 | #245 | Tragic 53.0% |
| Immigrants | Nigeria | 1.2 /100 | #246 | Tragic 52.9% |
| Sierra Leoneans | 1.2 /100 | #247 | Tragic 52.9% |
| Colombians | 1.1 /100 | #248 | Tragic 52.9% |
| Immigrants | Brazil | 1.0 /100 | #249 | Tragic 52.8% |
| Mongolians | 1.0 /100 | #250 | Tragic 52.8% |
| Immigrants | Sudan | 1.0 /100 | #251 | Tragic 52.8% |
| Immigrants | Portugal | 1.0 /100 | #252 | Tragic 52.8% |