Immigrants from Kazakhstan vs Immigrants from Ethiopia 9th Grade
COMPARE
Immigrants from Kazakhstan
Immigrants from Ethiopia
9th Grade
9th Grade Comparison
Immigrants from Kazakhstan
Immigrants from Ethiopia
95.1%
9TH GRADE
74.7/ 100
METRIC RATING
155th/ 347
METRIC RANK
94.3%
9TH GRADE
2.7/ 100
METRIC RATING
240th/ 347
METRIC RANK
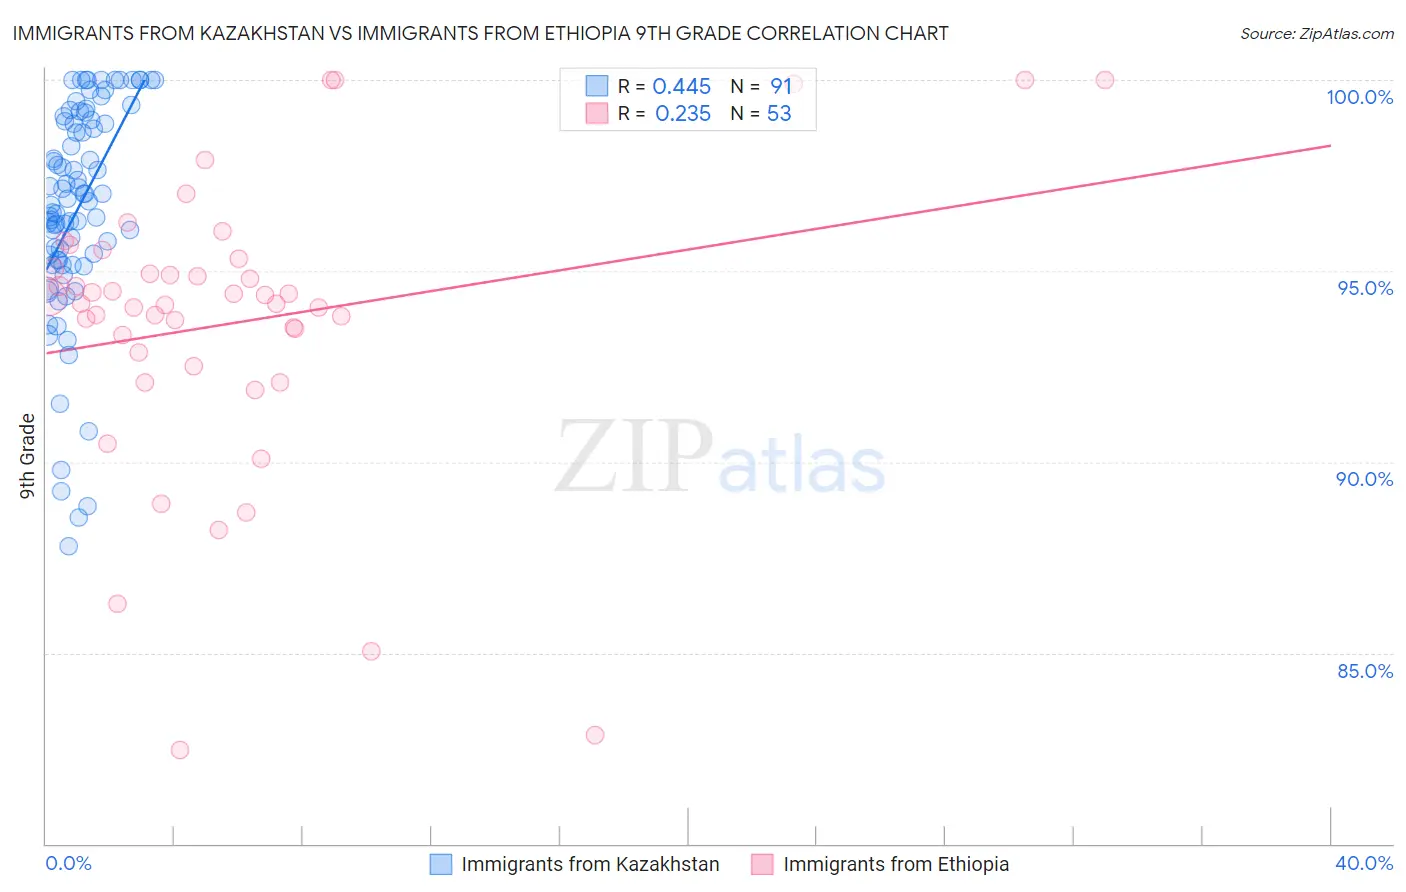
Immigrants from Kazakhstan vs Immigrants from Ethiopia 9th Grade Correlation Chart
The statistical analysis conducted on geographies consisting of 124,429,881 people shows a moderate positive correlation between the proportion of Immigrants from Kazakhstan and percentage of population with at least 9th grade education in the United States with a correlation coefficient (R) of 0.445 and weighted average of 95.1%. Similarly, the statistical analysis conducted on geographies consisting of 211,528,629 people shows a weak positive correlation between the proportion of Immigrants from Ethiopia and percentage of population with at least 9th grade education in the United States with a correlation coefficient (R) of 0.235 and weighted average of 94.3%, a difference of 0.86%.
9th Grade Correlation Summary
| Measurement | Immigrants from Kazakhstan | Immigrants from Ethiopia |
| Minimum | 87.8% | 82.4% |
| Maximum | 100.0% | 100.0% |
| Range | 12.2% | 17.6% |
| Mean | 96.6% | 93.7% |
| Median | 96.9% | 94.1% |
| Interquartile 25% (IQ1) | 95.3% | 92.7% |
| Interquartile 75% (IQ3) | 98.9% | 95.2% |
| Interquartile Range (IQR) | 3.7% | 2.5% |
| Standard Deviation (Sample) | 2.8% | 3.8% |
| Standard Deviation (Population) | 2.8% | 3.8% |
Similar Demographics by 9th Grade
Demographics Similar to Immigrants from Kazakhstan by 9th Grade
In terms of 9th grade, the demographic groups most similar to Immigrants from Kazakhstan are Arab (95.1%, a difference of 0.0%), Albanian (95.1%, a difference of 0.010%), Ugandan (95.1%, a difference of 0.020%), Immigrants from Kenya (95.0%, a difference of 0.020%), and Mongolian (95.0%, a difference of 0.020%).
| Demographics | Rating | Rank | 9th Grade |
| Immigrants | Jordan | 81.2 /100 | #148 | Excellent 95.1% |
| Immigrants | Korea | 79.6 /100 | #149 | Good 95.1% |
| Kenyans | 79.1 /100 | #150 | Good 95.1% |
| Cajuns | 77.3 /100 | #151 | Good 95.1% |
| Ugandans | 77.0 /100 | #152 | Good 95.1% |
| Albanians | 76.1 /100 | #153 | Good 95.1% |
| Arabs | 74.9 /100 | #154 | Good 95.1% |
| Immigrants | Kazakhstan | 74.7 /100 | #155 | Good 95.1% |
| Immigrants | Kenya | 73.1 /100 | #156 | Good 95.0% |
| Mongolians | 73.0 /100 | #157 | Good 95.0% |
| Egyptians | 70.1 /100 | #158 | Good 95.0% |
| Immigrants | Ukraine | 67.4 /100 | #159 | Good 95.0% |
| Immigrants | Italy | 66.6 /100 | #160 | Good 95.0% |
| French American Indians | 66.5 /100 | #161 | Good 95.0% |
| Bermudans | 65.8 /100 | #162 | Good 95.0% |
Demographics Similar to Immigrants from Ethiopia by 9th Grade
In terms of 9th grade, the demographic groups most similar to Immigrants from Ethiopia are Spanish American (94.2%, a difference of 0.0%), Korean (94.3%, a difference of 0.010%), South American Indian (94.3%, a difference of 0.010%), Immigrants from China (94.3%, a difference of 0.010%), and Somali (94.3%, a difference of 0.020%).
| Demographics | Rating | Rank | 9th Grade |
| Nigerians | 3.7 /100 | #233 | Tragic 94.3% |
| Costa Ricans | 3.5 /100 | #234 | Tragic 94.3% |
| Bolivians | 3.3 /100 | #235 | Tragic 94.3% |
| Somalis | 2.9 /100 | #236 | Tragic 94.3% |
| Koreans | 2.9 /100 | #237 | Tragic 94.3% |
| South American Indians | 2.8 /100 | #238 | Tragic 94.3% |
| Immigrants | China | 2.8 /100 | #239 | Tragic 94.3% |
| Immigrants | Ethiopia | 2.7 /100 | #240 | Tragic 94.3% |
| Spanish Americans | 2.6 /100 | #241 | Tragic 94.2% |
| Immigrants | Middle Africa | 2.2 /100 | #242 | Tragic 94.2% |
| Immigrants | Cameroon | 2.1 /100 | #243 | Tragic 94.2% |
| Dutch West Indians | 2.0 /100 | #244 | Tragic 94.2% |
| Paiute | 1.9 /100 | #245 | Tragic 94.2% |
| Senegalese | 1.9 /100 | #246 | Tragic 94.2% |
| Afghans | 1.8 /100 | #247 | Tragic 94.2% |