Immigrants from Kazakhstan vs Afghan 2 or more Vehicles in Household
COMPARE
Immigrants from Kazakhstan
Afghan
2 or more Vehicles in Household
2 or more Vehicles in Household Comparison
Immigrants from Kazakhstan
Afghans
51.6%
2 OR MORE VEHICLES IN HOUSEHOLD
0.1/ 100
METRIC RATING
281st/ 347
METRIC RANK
59.0%
2 OR MORE VEHICLES IN HOUSEHOLD
99.9/ 100
METRIC RATING
57th/ 347
METRIC RANK
Immigrants from Kazakhstan vs Afghan 2 or more Vehicles in Household Correlation Chart
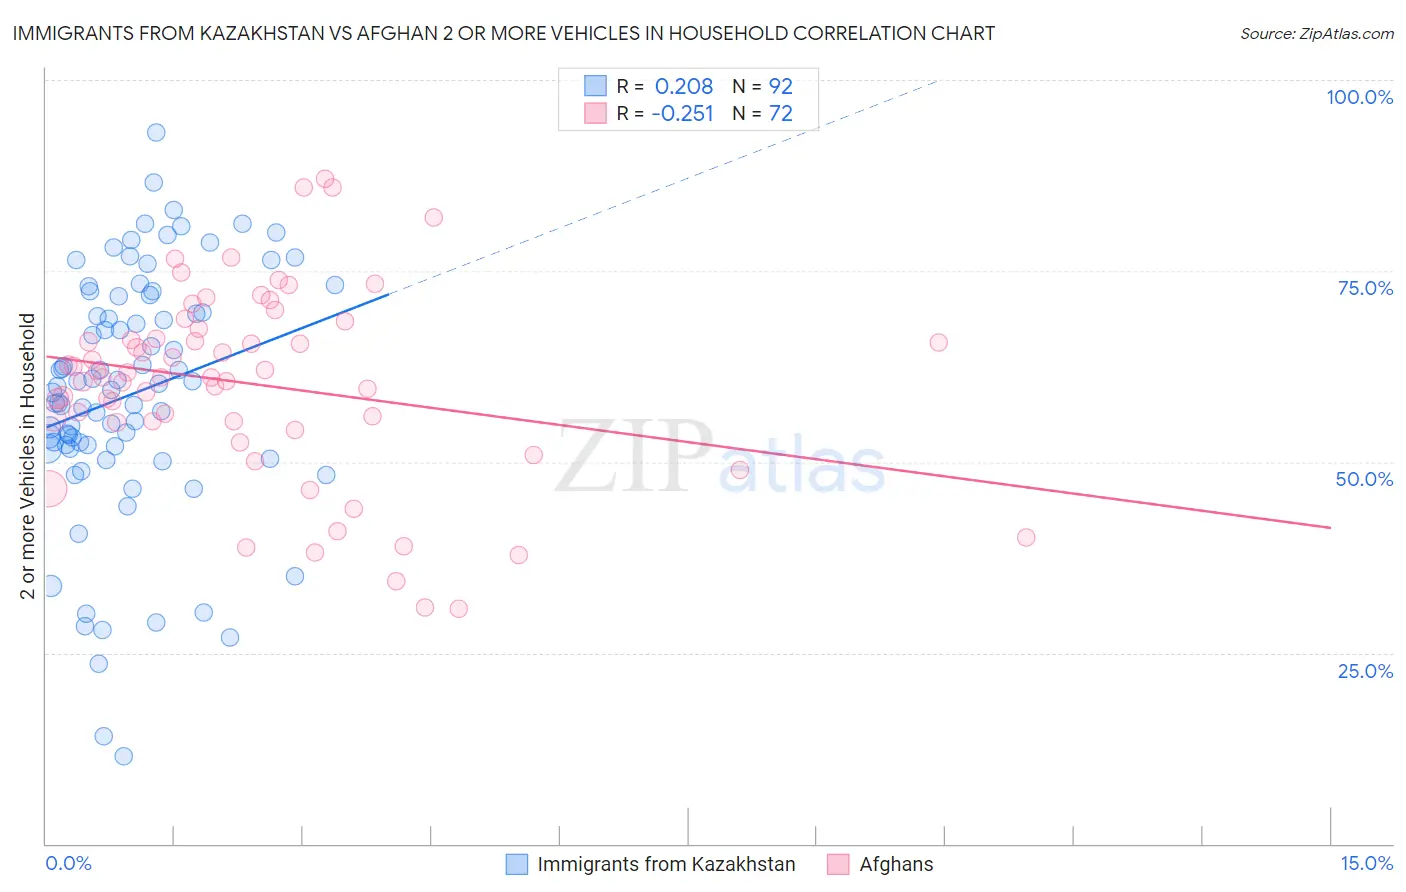
The statistical analysis conducted on geographies consisting of 124,427,212 people shows a weak positive correlation between the proportion of Immigrants from Kazakhstan and percentage of households with 2 or more vehicles available in the United States with a correlation coefficient (R) of 0.208 and weighted average of 51.6%. Similarly, the statistical analysis conducted on geographies consisting of 148,831,306 people shows a weak negative correlation between the proportion of Afghans and percentage of households with 2 or more vehicles available in the United States with a correlation coefficient (R) of -0.251 and weighted average of 59.0%, a difference of 14.4%.
2 or more Vehicles in Household Correlation Summary
| Measurement | Immigrants from Kazakhstan | Afghan |
| Minimum | 11.5% | 30.8% |
| Maximum | 93.1% | 87.1% |
| Range | 81.6% | 56.3% |
| Mean | 58.8% | 60.2% |
| Median | 59.6% | 61.1% |
| Interquartile 25% (IQ1) | 51.8% | 55.3% |
| Interquartile 75% (IQ3) | 70.7% | 66.8% |
| Interquartile Range (IQR) | 18.8% | 11.5% |
| Standard Deviation (Sample) | 16.2% | 12.6% |
| Standard Deviation (Population) | 16.1% | 12.5% |
Similar Demographics by 2 or more Vehicles in Household
Demographics Similar to Immigrants from Kazakhstan by 2 or more Vehicles in Household
In terms of 2 or more vehicles in household, the demographic groups most similar to Immigrants from Kazakhstan are Bahamian (51.5%, a difference of 0.060%), Immigrants from China (51.5%, a difference of 0.14%), Immigrants from Zaire (51.5%, a difference of 0.18%), Immigrants from Eastern Europe (51.7%, a difference of 0.31%), and Immigrants from Uruguay (51.4%, a difference of 0.34%).
| Demographics | Rating | Rank | 2 or more Vehicles in Household |
| Africans | 0.2 /100 | #274 | Tragic 51.8% |
| Immigrants | Honduras | 0.2 /100 | #275 | Tragic 51.8% |
| Immigrants | Croatia | 0.2 /100 | #276 | Tragic 51.8% |
| Immigrants | Africa | 0.2 /100 | #277 | Tragic 51.8% |
| Yuman | 0.1 /100 | #278 | Tragic 51.7% |
| Liberians | 0.1 /100 | #279 | Tragic 51.7% |
| Immigrants | Eastern Europe | 0.1 /100 | #280 | Tragic 51.7% |
| Immigrants | Kazakhstan | 0.1 /100 | #281 | Tragic 51.6% |
| Bahamians | 0.1 /100 | #282 | Tragic 51.5% |
| Immigrants | China | 0.1 /100 | #283 | Tragic 51.5% |
| Immigrants | Zaire | 0.1 /100 | #284 | Tragic 51.5% |
| Immigrants | Uruguay | 0.1 /100 | #285 | Tragic 51.4% |
| Immigrants | Liberia | 0.1 /100 | #286 | Tragic 51.3% |
| Immigrants | Serbia | 0.1 /100 | #287 | Tragic 51.3% |
| Okinawans | 0.1 /100 | #288 | Tragic 51.2% |
Demographics Similar to Afghans by 2 or more Vehicles in Household
In terms of 2 or more vehicles in household, the demographic groups most similar to Afghans are Chickasaw (59.0%, a difference of 0.0%), Luxembourger (59.1%, a difference of 0.11%), Bhutanese (59.1%, a difference of 0.14%), Immigrants from Scotland (58.9%, a difference of 0.18%), and Spanish American (58.9%, a difference of 0.21%).
| Demographics | Rating | Rank | 2 or more Vehicles in Household |
| Choctaw | 99.9 /100 | #50 | Exceptional 59.3% |
| Spaniards | 99.9 /100 | #51 | Exceptional 59.2% |
| Immigrants | Laos | 99.9 /100 | #52 | Exceptional 59.2% |
| Celtics | 99.9 /100 | #53 | Exceptional 59.2% |
| Bhutanese | 99.9 /100 | #54 | Exceptional 59.1% |
| Luxembourgers | 99.9 /100 | #55 | Exceptional 59.1% |
| Chickasaw | 99.9 /100 | #56 | Exceptional 59.0% |
| Afghans | 99.9 /100 | #57 | Exceptional 59.0% |
| Immigrants | Scotland | 99.8 /100 | #58 | Exceptional 58.9% |
| Spanish Americans | 99.8 /100 | #59 | Exceptional 58.9% |
| French Canadians | 99.8 /100 | #60 | Exceptional 58.9% |
| Osage | 99.8 /100 | #61 | Exceptional 58.8% |
| Immigrants | Nonimmigrants | 99.8 /100 | #62 | Exceptional 58.8% |
| Mexican American Indians | 99.8 /100 | #63 | Exceptional 58.7% |
| Portuguese | 99.7 /100 | #64 | Exceptional 58.6% |