Australian vs Immigrants from Ethiopia 2 or more Vehicles in Household
COMPARE
Australian
Immigrants from Ethiopia
2 or more Vehicles in Household
2 or more Vehicles in Household Comparison
Australians
Immigrants from Ethiopia
56.7%
2 OR MORE VEHICLES IN HOUSEHOLD
91.8/ 100
METRIC RATING
123rd/ 347
METRIC RANK
53.0%
2 OR MORE VEHICLES IN HOUSEHOLD
1.5/ 100
METRIC RATING
245th/ 347
METRIC RANK
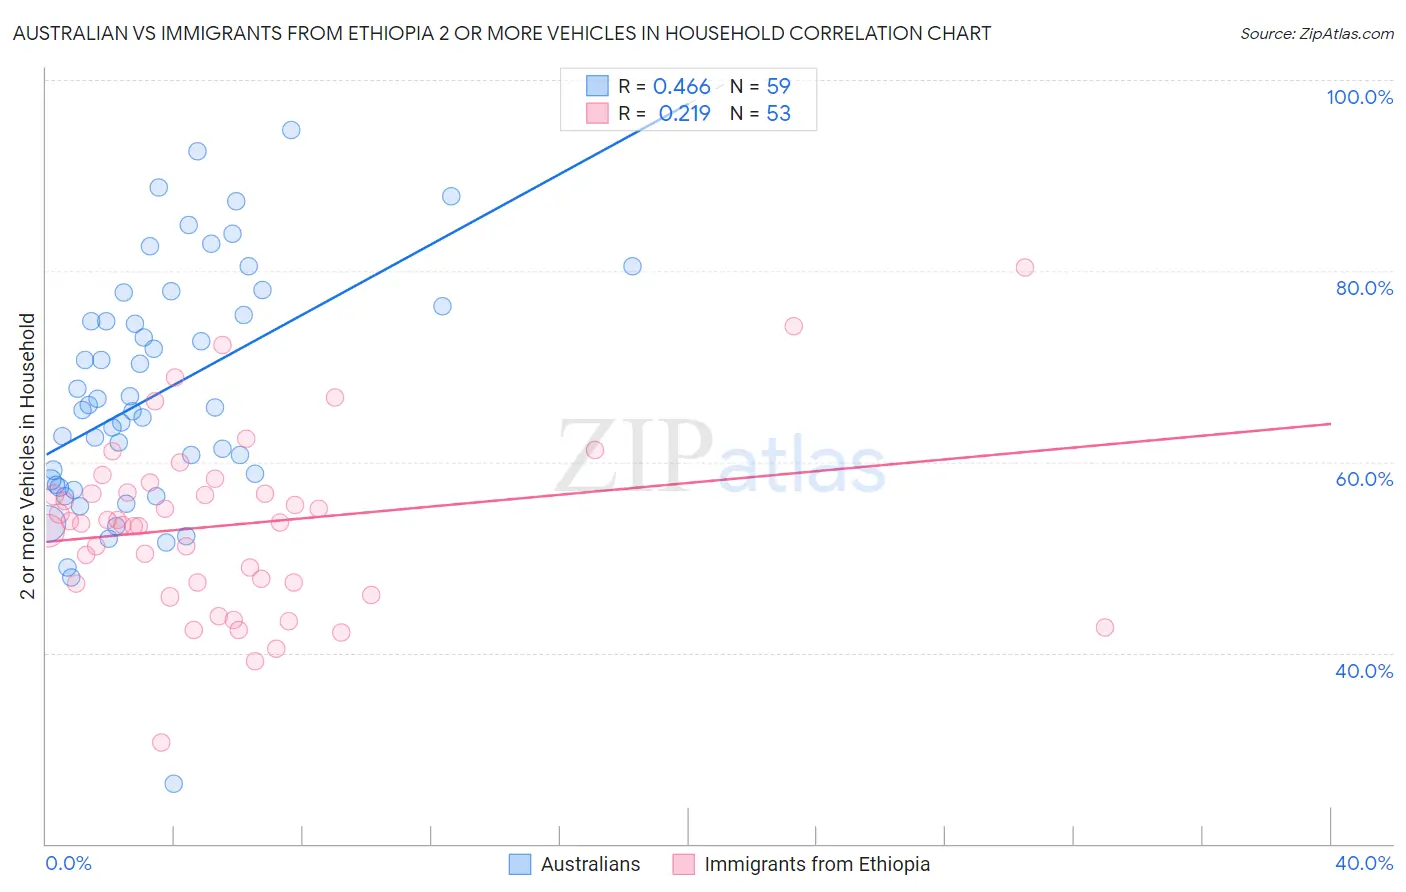
Australian vs Immigrants from Ethiopia 2 or more Vehicles in Household Correlation Chart
The statistical analysis conducted on geographies consisting of 223,999,190 people shows a moderate positive correlation between the proportion of Australians and percentage of households with 2 or more vehicles available in the United States with a correlation coefficient (R) of 0.466 and weighted average of 56.7%. Similarly, the statistical analysis conducted on geographies consisting of 211,485,366 people shows a weak positive correlation between the proportion of Immigrants from Ethiopia and percentage of households with 2 or more vehicles available in the United States with a correlation coefficient (R) of 0.219 and weighted average of 53.0%, a difference of 6.9%.
2 or more Vehicles in Household Correlation Summary
| Measurement | Australian | Immigrants from Ethiopia |
| Minimum | 26.3% | 30.6% |
| Maximum | 94.7% | 80.4% |
| Range | 68.4% | 49.7% |
| Mean | 67.3% | 53.4% |
| Median | 65.7% | 53.7% |
| Interquartile 25% (IQ1) | 57.6% | 47.3% |
| Interquartile 75% (IQ3) | 76.3% | 57.3% |
| Interquartile Range (IQR) | 18.7% | 10.0% |
| Standard Deviation (Sample) | 12.9% | 9.3% |
| Standard Deviation (Population) | 12.8% | 9.2% |
Similar Demographics by 2 or more Vehicles in Household
Demographics Similar to Australians by 2 or more Vehicles in Household
In terms of 2 or more vehicles in household, the demographic groups most similar to Australians are New Zealander (56.7%, a difference of 0.0%), Tsimshian (56.7%, a difference of 0.030%), Immigrants from South Africa (56.7%, a difference of 0.090%), Estonian (56.6%, a difference of 0.11%), and Immigrants from Thailand (56.6%, a difference of 0.14%).
| Demographics | Rating | Rank | 2 or more Vehicles in Household |
| Immigrants | Jordan | 96.6 /100 | #116 | Exceptional 57.2% |
| Iraqis | 95.8 /100 | #117 | Exceptional 57.1% |
| Asians | 95.1 /100 | #118 | Exceptional 57.0% |
| Natives/Alaskans | 95.0 /100 | #119 | Exceptional 57.0% |
| Costa Ricans | 94.7 /100 | #120 | Exceptional 56.9% |
| Sioux | 93.8 /100 | #121 | Exceptional 56.8% |
| Immigrants | South Africa | 92.5 /100 | #122 | Exceptional 56.7% |
| Australians | 91.8 /100 | #123 | Exceptional 56.7% |
| New Zealanders | 91.8 /100 | #124 | Exceptional 56.7% |
| Tsimshian | 91.6 /100 | #125 | Exceptional 56.7% |
| Estonians | 90.9 /100 | #126 | Exceptional 56.6% |
| Immigrants | Thailand | 90.7 /100 | #127 | Exceptional 56.6% |
| Immigrants | South Central Asia | 90.5 /100 | #128 | Exceptional 56.6% |
| Ute | 90.4 /100 | #129 | Exceptional 56.6% |
| Yugoslavians | 90.0 /100 | #130 | Exceptional 56.6% |
Demographics Similar to Immigrants from Ethiopia by 2 or more Vehicles in Household
In terms of 2 or more vehicles in household, the demographic groups most similar to Immigrants from Ethiopia are Indian (Asian) (53.1%, a difference of 0.12%), Ethiopian (53.1%, a difference of 0.16%), Immigrants from Nigeria (52.9%, a difference of 0.20%), Sierra Leonean (52.9%, a difference of 0.22%), and Immigrants from Eastern Asia (53.2%, a difference of 0.35%).
| Demographics | Rating | Rank | 2 or more Vehicles in Household |
| Immigrants | Armenia | 2.3 /100 | #238 | Tragic 53.3% |
| Cambodians | 2.3 /100 | #239 | Tragic 53.3% |
| Immigrants | Europe | 2.1 /100 | #240 | Tragic 53.2% |
| Immigrants | Sierra Leone | 2.1 /100 | #241 | Tragic 53.2% |
| Immigrants | Eastern Asia | 2.1 /100 | #242 | Tragic 53.2% |
| Ethiopians | 1.7 /100 | #243 | Tragic 53.1% |
| Indians (Asian) | 1.7 /100 | #244 | Tragic 53.1% |
| Immigrants | Ethiopia | 1.5 /100 | #245 | Tragic 53.0% |
| Immigrants | Nigeria | 1.2 /100 | #246 | Tragic 52.9% |
| Sierra Leoneans | 1.2 /100 | #247 | Tragic 52.9% |
| Colombians | 1.1 /100 | #248 | Tragic 52.9% |
| Immigrants | Brazil | 1.0 /100 | #249 | Tragic 52.8% |
| Mongolians | 1.0 /100 | #250 | Tragic 52.8% |
| Immigrants | Sudan | 1.0 /100 | #251 | Tragic 52.8% |
| Immigrants | Portugal | 1.0 /100 | #252 | Tragic 52.8% |