German vs Immigrants from Ethiopia 2 or more Vehicles in Household
COMPARE
German
Immigrants from Ethiopia
2 or more Vehicles in Household
2 or more Vehicles in Household Comparison
Germans
Immigrants from Ethiopia
61.6%
2 OR MORE VEHICLES IN HOUSEHOLD
100.0/ 100
METRIC RATING
12th/ 347
METRIC RANK
53.0%
2 OR MORE VEHICLES IN HOUSEHOLD
1.5/ 100
METRIC RATING
245th/ 347
METRIC RANK
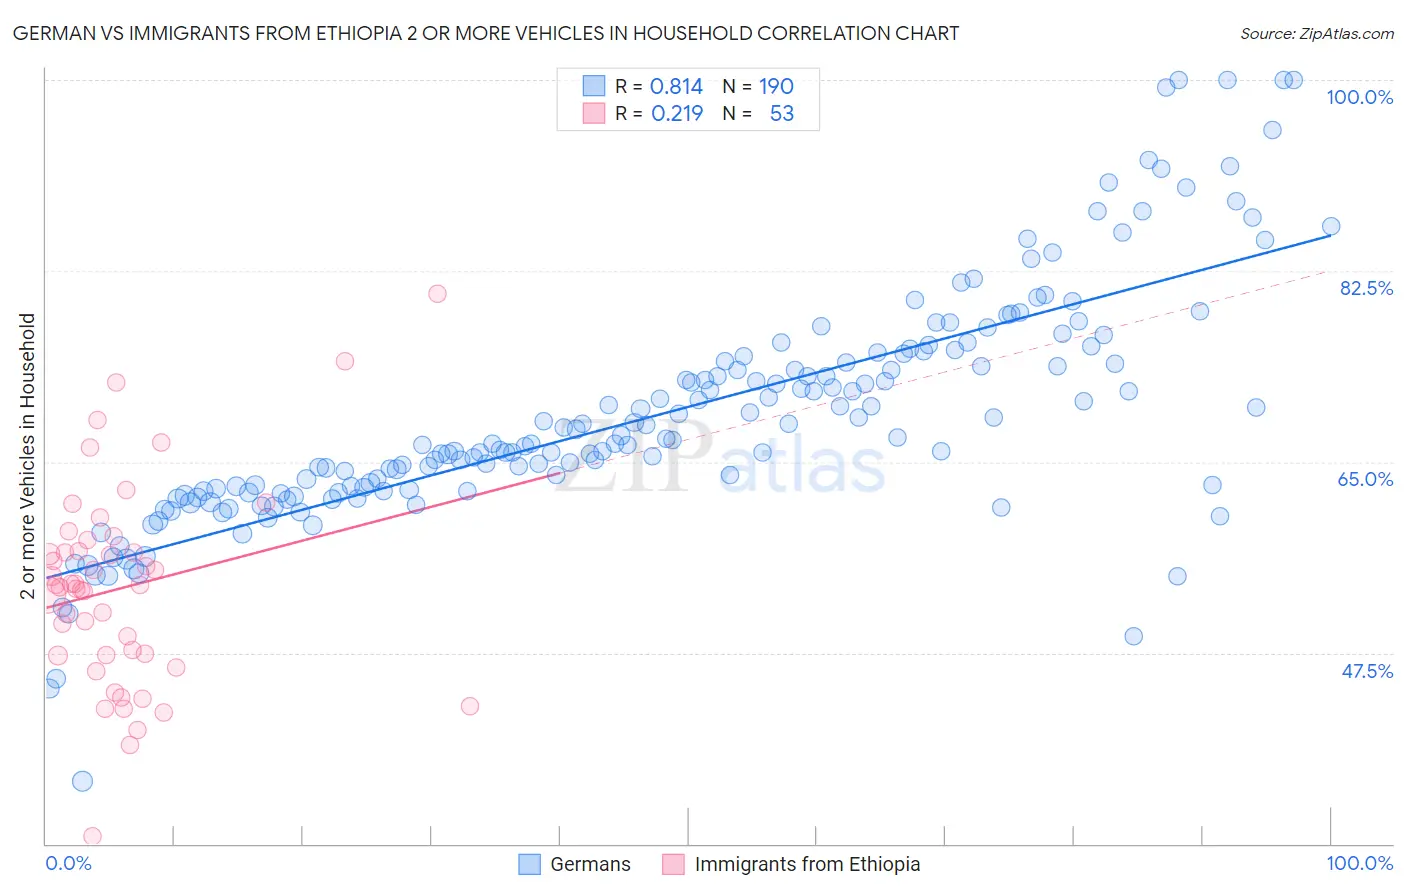
German vs Immigrants from Ethiopia 2 or more Vehicles in Household Correlation Chart
The statistical analysis conducted on geographies consisting of 580,661,137 people shows a very strong positive correlation between the proportion of Germans and percentage of households with 2 or more vehicles available in the United States with a correlation coefficient (R) of 0.814 and weighted average of 61.6%. Similarly, the statistical analysis conducted on geographies consisting of 211,485,366 people shows a weak positive correlation between the proportion of Immigrants from Ethiopia and percentage of households with 2 or more vehicles available in the United States with a correlation coefficient (R) of 0.219 and weighted average of 53.0%, a difference of 16.1%.
2 or more Vehicles in Household Correlation Summary
| Measurement | German | Immigrants from Ethiopia |
| Minimum | 35.8% | 30.6% |
| Maximum | 100.0% | 80.4% |
| Range | 64.2% | 49.7% |
| Mean | 69.3% | 53.4% |
| Median | 67.1% | 53.7% |
| Interquartile 25% (IQ1) | 62.3% | 47.3% |
| Interquartile 75% (IQ3) | 74.6% | 57.3% |
| Interquartile Range (IQR) | 12.3% | 10.0% |
| Standard Deviation (Sample) | 10.7% | 9.3% |
| Standard Deviation (Population) | 10.7% | 9.2% |
Similar Demographics by 2 or more Vehicles in Household
Demographics Similar to Germans by 2 or more Vehicles in Household
In terms of 2 or more vehicles in household, the demographic groups most similar to Germans are Dutch (61.6%, a difference of 0.11%), Samoan (61.5%, a difference of 0.12%), Czech (61.5%, a difference of 0.16%), Mexican (61.7%, a difference of 0.17%), and Nepalese (61.4%, a difference of 0.25%).
| Demographics | Rating | Rank | 2 or more Vehicles in Household |
| Immigrants | Fiji | 100.0 /100 | #5 | Exceptional 62.3% |
| Scandinavians | 100.0 /100 | #6 | Exceptional 62.1% |
| Puget Sound Salish | 100.0 /100 | #7 | Exceptional 62.1% |
| English | 100.0 /100 | #8 | Exceptional 61.9% |
| Swedes | 100.0 /100 | #9 | Exceptional 61.8% |
| Mexicans | 100.0 /100 | #10 | Exceptional 61.7% |
| Dutch | 100.0 /100 | #11 | Exceptional 61.6% |
| Germans | 100.0 /100 | #12 | Exceptional 61.6% |
| Samoans | 100.0 /100 | #13 | Exceptional 61.5% |
| Czechs | 100.0 /100 | #14 | Exceptional 61.5% |
| Nepalese | 100.0 /100 | #15 | Exceptional 61.4% |
| Native Hawaiians | 100.0 /100 | #16 | Exceptional 61.4% |
| Basques | 100.0 /100 | #17 | Exceptional 61.4% |
| Europeans | 100.0 /100 | #18 | Exceptional 61.4% |
| Scottish | 100.0 /100 | #19 | Exceptional 61.2% |
Demographics Similar to Immigrants from Ethiopia by 2 or more Vehicles in Household
In terms of 2 or more vehicles in household, the demographic groups most similar to Immigrants from Ethiopia are Indian (Asian) (53.1%, a difference of 0.12%), Ethiopian (53.1%, a difference of 0.16%), Immigrants from Nigeria (52.9%, a difference of 0.20%), Sierra Leonean (52.9%, a difference of 0.22%), and Immigrants from Eastern Asia (53.2%, a difference of 0.35%).
| Demographics | Rating | Rank | 2 or more Vehicles in Household |
| Immigrants | Armenia | 2.3 /100 | #238 | Tragic 53.3% |
| Cambodians | 2.3 /100 | #239 | Tragic 53.3% |
| Immigrants | Europe | 2.1 /100 | #240 | Tragic 53.2% |
| Immigrants | Sierra Leone | 2.1 /100 | #241 | Tragic 53.2% |
| Immigrants | Eastern Asia | 2.1 /100 | #242 | Tragic 53.2% |
| Ethiopians | 1.7 /100 | #243 | Tragic 53.1% |
| Indians (Asian) | 1.7 /100 | #244 | Tragic 53.1% |
| Immigrants | Ethiopia | 1.5 /100 | #245 | Tragic 53.0% |
| Immigrants | Nigeria | 1.2 /100 | #246 | Tragic 52.9% |
| Sierra Leoneans | 1.2 /100 | #247 | Tragic 52.9% |
| Colombians | 1.1 /100 | #248 | Tragic 52.9% |
| Immigrants | Brazil | 1.0 /100 | #249 | Tragic 52.8% |
| Mongolians | 1.0 /100 | #250 | Tragic 52.8% |
| Immigrants | Sudan | 1.0 /100 | #251 | Tragic 52.8% |
| Immigrants | Portugal | 1.0 /100 | #252 | Tragic 52.8% |