Afghan vs West Indian 4 or more Vehicles in Household
COMPARE
Afghan
West Indian
4 or more Vehicles in Household
4 or more Vehicles in Household Comparison
Afghans
West Indians
7.3%
4 OR MORE VEHICLES IN HOUSEHOLD
99.7/ 100
METRIC RATING
84th/ 347
METRIC RANK
4.2%
4 OR MORE VEHICLES IN HOUSEHOLD
0.0/ 100
METRIC RATING
331st/ 347
METRIC RANK
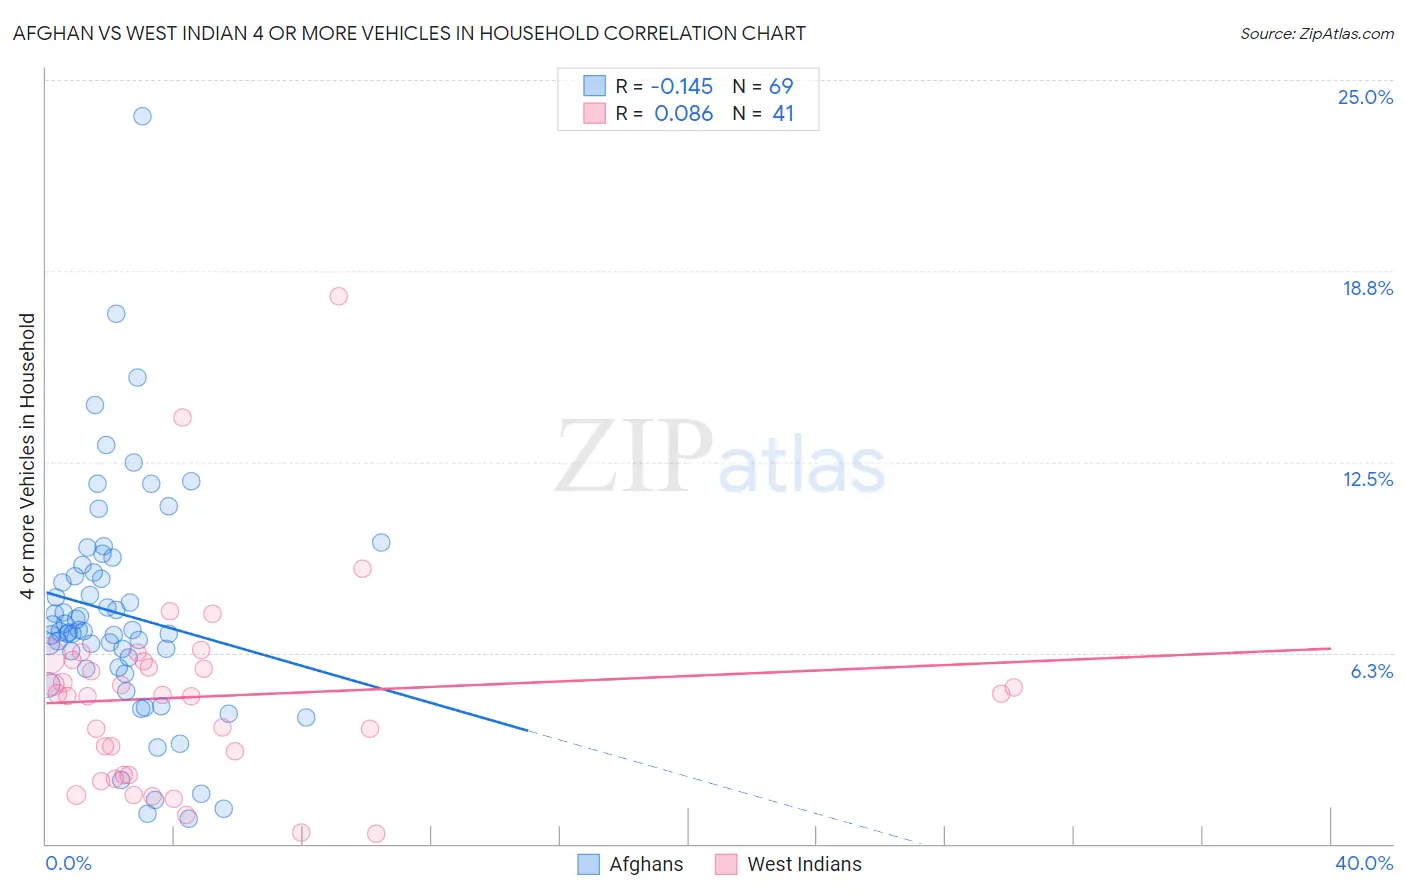
Afghan vs West Indian 4 or more Vehicles in Household Correlation Chart
The statistical analysis conducted on geographies consisting of 148,454,289 people shows a poor negative correlation between the proportion of Afghans and percentage of households with 4 or more vehicles available in the United States with a correlation coefficient (R) of -0.145 and weighted average of 7.3%. Similarly, the statistical analysis conducted on geographies consisting of 252,612,993 people shows a slight positive correlation between the proportion of West Indians and percentage of households with 4 or more vehicles available in the United States with a correlation coefficient (R) of 0.086 and weighted average of 4.2%, a difference of 71.8%.
4 or more Vehicles in Household Correlation Summary
| Measurement | Afghan | West Indian |
| Minimum | 0.82% | 0.34% |
| Maximum | 23.8% | 17.9% |
| Range | 23.0% | 17.6% |
| Mean | 7.5% | 4.8% |
| Median | 7.0% | 4.9% |
| Interquartile 25% (IQ1) | 5.8% | 2.3% |
| Interquartile 75% (IQ3) | 9.0% | 6.0% |
| Interquartile Range (IQR) | 3.2% | 3.7% |
| Standard Deviation (Sample) | 3.8% | 3.3% |
| Standard Deviation (Population) | 3.8% | 3.3% |
Similar Demographics by 4 or more Vehicles in Household
Demographics Similar to Afghans by 4 or more Vehicles in Household
In terms of 4 or more vehicles in household, the demographic groups most similar to Afghans are Cree (7.2%, a difference of 0.17%), Potawatomi (7.3%, a difference of 0.33%), Immigrants from Indonesia (7.2%, a difference of 0.35%), Delaware (7.2%, a difference of 0.41%), and Nonimmigrants (7.2%, a difference of 0.43%).
| Demographics | Rating | Rank | 4 or more Vehicles in Household |
| Apache | 99.9 /100 | #77 | Exceptional 7.4% |
| Whites/Caucasians | 99.8 /100 | #78 | Exceptional 7.4% |
| Czechs | 99.8 /100 | #79 | Exceptional 7.4% |
| Alaska Natives | 99.8 /100 | #80 | Exceptional 7.3% |
| Finns | 99.8 /100 | #81 | Exceptional 7.3% |
| Northern Europeans | 99.8 /100 | #82 | Exceptional 7.3% |
| Potawatomi | 99.7 /100 | #83 | Exceptional 7.3% |
| Afghans | 99.7 /100 | #84 | Exceptional 7.3% |
| Cree | 99.7 /100 | #85 | Exceptional 7.2% |
| Immigrants | Indonesia | 99.6 /100 | #86 | Exceptional 7.2% |
| Delaware | 99.6 /100 | #87 | Exceptional 7.2% |
| Immigrants | Nonimmigrants | 99.6 /100 | #88 | Exceptional 7.2% |
| British | 99.6 /100 | #89 | Exceptional 7.2% |
| Creek | 99.6 /100 | #90 | Exceptional 7.2% |
| Assyrians/Chaldeans/Syriacs | 99.4 /100 | #91 | Exceptional 7.2% |
Demographics Similar to West Indians by 4 or more Vehicles in Household
In terms of 4 or more vehicles in household, the demographic groups most similar to West Indians are Immigrants from Ecuador (4.2%, a difference of 0.26%), Immigrants from Senegal (4.2%, a difference of 0.46%), Trinidadian and Tobagonian (4.3%, a difference of 0.73%), Immigrants from Dominica (4.2%, a difference of 0.90%), and Senegalese (4.3%, a difference of 2.3%).
| Demographics | Rating | Rank | 4 or more Vehicles in Household |
| Soviet Union | 0.0 /100 | #324 | Tragic 4.4% |
| Immigrants | Jamaica | 0.0 /100 | #325 | Tragic 4.4% |
| Cape Verdeans | 0.0 /100 | #326 | Tragic 4.4% |
| Senegalese | 0.0 /100 | #327 | Tragic 4.3% |
| Trinidadians and Tobagonians | 0.0 /100 | #328 | Tragic 4.3% |
| Immigrants | Senegal | 0.0 /100 | #329 | Tragic 4.2% |
| Immigrants | Ecuador | 0.0 /100 | #330 | Tragic 4.2% |
| West Indians | 0.0 /100 | #331 | Tragic 4.2% |
| Immigrants | Dominica | 0.0 /100 | #332 | Tragic 4.2% |
| Immigrants | Albania | 0.0 /100 | #333 | Tragic 4.1% |
| Immigrants | Trinidad and Tobago | 0.0 /100 | #334 | Tragic 4.1% |
| Barbadians | 0.0 /100 | #335 | Tragic 3.9% |
| Immigrants | Bangladesh | 0.0 /100 | #336 | Tragic 3.9% |
| Vietnamese | 0.0 /100 | #337 | Tragic 3.9% |
| Immigrants | Cabo Verde | 0.0 /100 | #338 | Tragic 3.8% |