Immigrants from Japan vs West Indian GED/Equivalency
COMPARE
Immigrants from Japan
West Indian
GED/Equivalency
GED/Equivalency Comparison
Immigrants from Japan
West Indians
88.4%
GED/EQUIVALENCY
99.7/ 100
METRIC RATING
34th/ 347
METRIC RANK
83.1%
GED/EQUIVALENCY
0.2/ 100
METRIC RATING
265th/ 347
METRIC RANK
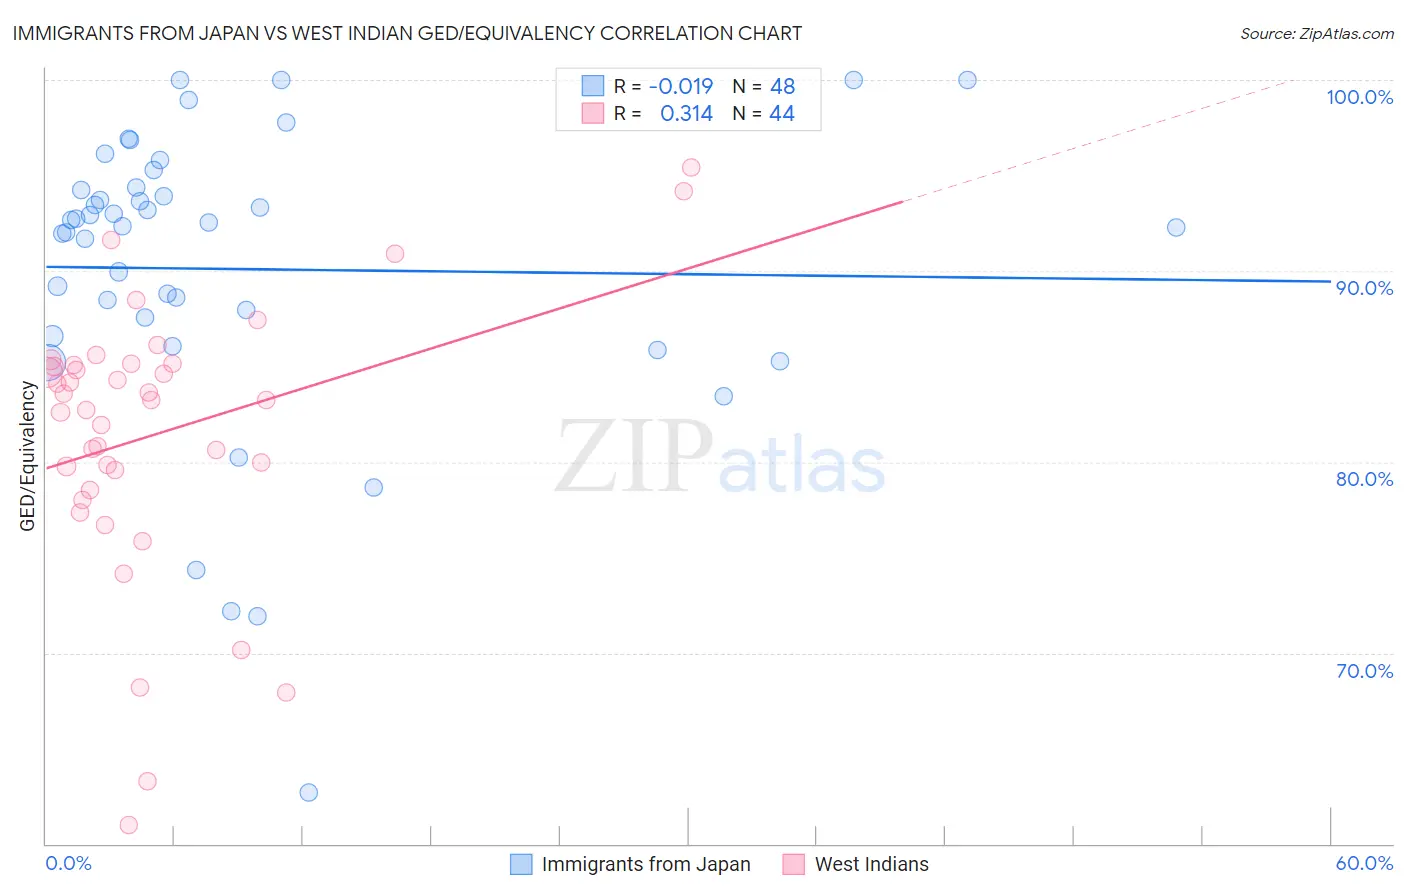
Immigrants from Japan vs West Indian GED/Equivalency Correlation Chart
The statistical analysis conducted on geographies consisting of 340,148,851 people shows no correlation between the proportion of Immigrants from Japan and percentage of population with at least ged/equivalency education in the United States with a correlation coefficient (R) of -0.019 and weighted average of 88.4%. Similarly, the statistical analysis conducted on geographies consisting of 254,063,654 people shows a mild positive correlation between the proportion of West Indians and percentage of population with at least ged/equivalency education in the United States with a correlation coefficient (R) of 0.314 and weighted average of 83.1%, a difference of 6.4%.
GED/Equivalency Correlation Summary
| Measurement | Immigrants from Japan | West Indian |
| Minimum | 62.7% | 61.0% |
| Maximum | 100.0% | 95.4% |
| Range | 37.3% | 34.5% |
| Mean | 90.1% | 81.5% |
| Median | 92.4% | 83.3% |
| Interquartile 25% (IQ1) | 87.1% | 79.0% |
| Interquartile 75% (IQ3) | 94.3% | 85.1% |
| Interquartile Range (IQR) | 7.2% | 6.1% |
| Standard Deviation (Sample) | 7.9% | 7.2% |
| Standard Deviation (Population) | 7.8% | 7.1% |
Similar Demographics by GED/Equivalency
Demographics Similar to Immigrants from Japan by GED/Equivalency
In terms of ged/equivalency, the demographic groups most similar to Immigrants from Japan are Immigrants from Sweden (88.4%, a difference of 0.010%), Immigrants from South Central Asia (88.4%, a difference of 0.020%), Immigrants from Belgium (88.3%, a difference of 0.040%), Danish (88.4%, a difference of 0.050%), and Bhutanese (88.4%, a difference of 0.070%).
| Demographics | Rating | Rank | GED/Equivalency |
| Immigrants | Lithuania | 99.8 /100 | #27 | Exceptional 88.6% |
| Immigrants | Northern Europe | 99.8 /100 | #28 | Exceptional 88.5% |
| Poles | 99.8 /100 | #29 | Exceptional 88.5% |
| Turks | 99.8 /100 | #30 | Exceptional 88.5% |
| Bhutanese | 99.8 /100 | #31 | Exceptional 88.4% |
| Danes | 99.8 /100 | #32 | Exceptional 88.4% |
| Immigrants | Sweden | 99.7 /100 | #33 | Exceptional 88.4% |
| Immigrants | Japan | 99.7 /100 | #34 | Exceptional 88.4% |
| Immigrants | South Central Asia | 99.7 /100 | #35 | Exceptional 88.4% |
| Immigrants | Belgium | 99.7 /100 | #36 | Exceptional 88.3% |
| Immigrants | Austria | 99.7 /100 | #37 | Exceptional 88.3% |
| Burmese | 99.7 /100 | #38 | Exceptional 88.3% |
| Immigrants | Israel | 99.6 /100 | #39 | Exceptional 88.2% |
| Italians | 99.6 /100 | #40 | Exceptional 88.2% |
| Finns | 99.6 /100 | #41 | Exceptional 88.2% |
Demographics Similar to West Indians by GED/Equivalency
In terms of ged/equivalency, the demographic groups most similar to West Indians are Bangladeshi (83.1%, a difference of 0.010%), Kiowa (83.1%, a difference of 0.010%), Immigrants from Congo (83.1%, a difference of 0.020%), Trinidadian and Tobagonian (83.0%, a difference of 0.020%), and Inupiat (83.1%, a difference of 0.030%).
| Demographics | Rating | Rank | GED/Equivalency |
| Malaysians | 0.4 /100 | #258 | Tragic 83.3% |
| Immigrants | Vietnam | 0.3 /100 | #259 | Tragic 83.2% |
| Choctaw | 0.3 /100 | #260 | Tragic 83.1% |
| Inupiat | 0.2 /100 | #261 | Tragic 83.1% |
| Immigrants | Armenia | 0.2 /100 | #262 | Tragic 83.1% |
| Immigrants | Congo | 0.2 /100 | #263 | Tragic 83.1% |
| Bangladeshis | 0.2 /100 | #264 | Tragic 83.1% |
| West Indians | 0.2 /100 | #265 | Tragic 83.1% |
| Kiowa | 0.2 /100 | #266 | Tragic 83.1% |
| Trinidadians and Tobagonians | 0.2 /100 | #267 | Tragic 83.0% |
| Immigrants | Burma/Myanmar | 0.2 /100 | #268 | Tragic 83.0% |
| Hopi | 0.2 /100 | #269 | Tragic 83.0% |
| Immigrants | Jamaica | 0.2 /100 | #270 | Tragic 82.9% |
| U.S. Virgin Islanders | 0.2 /100 | #271 | Tragic 82.9% |
| Barbadians | 0.1 /100 | #272 | Tragic 82.9% |