Immigrants from Israel vs Indonesian 3 or more Vehicles in Household
COMPARE
Immigrants from Israel
Indonesian
3 or more Vehicles in Household
3 or more Vehicles in Household Comparison
Immigrants from Israel
Indonesians
15.6%
3 OR MORE VEHICLES IN HOUSEHOLD
0.0/ 100
METRIC RATING
313th/ 347
METRIC RANK
18.3%
3 OR MORE VEHICLES IN HOUSEHOLD
3.5/ 100
METRIC RATING
237th/ 347
METRIC RANK
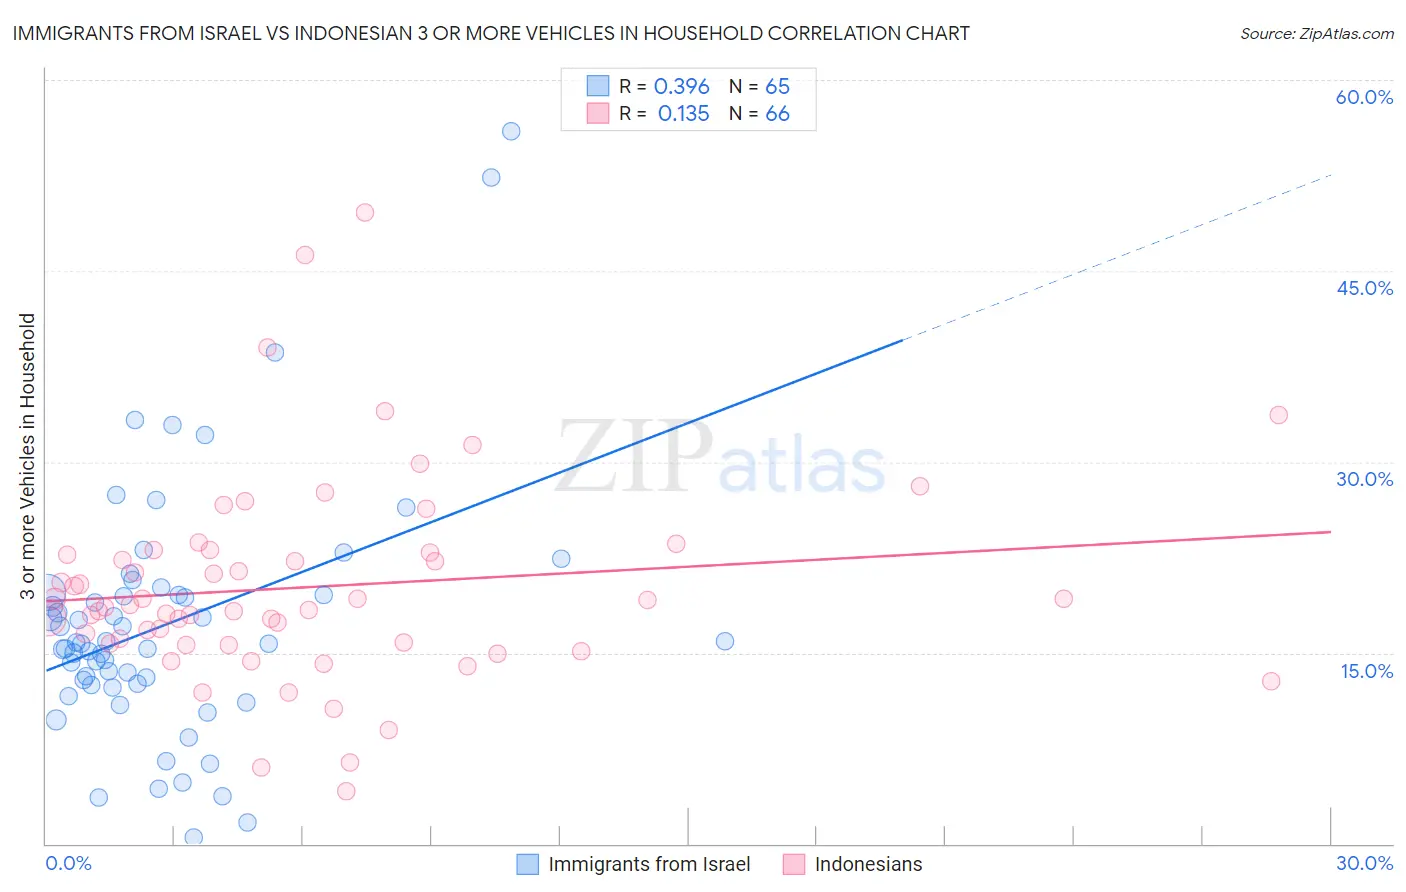
Immigrants from Israel vs Indonesian 3 or more Vehicles in Household Correlation Chart
The statistical analysis conducted on geographies consisting of 209,931,156 people shows a mild positive correlation between the proportion of Immigrants from Israel and percentage of households with 3 or more vehicles available in the United States with a correlation coefficient (R) of 0.396 and weighted average of 15.6%. Similarly, the statistical analysis conducted on geographies consisting of 162,622,478 people shows a poor positive correlation between the proportion of Indonesians and percentage of households with 3 or more vehicles available in the United States with a correlation coefficient (R) of 0.135 and weighted average of 18.3%, a difference of 17.0%.
3 or more Vehicles in Household Correlation Summary
| Measurement | Immigrants from Israel | Indonesian |
| Minimum | 0.45% | 4.1% |
| Maximum | 55.9% | 49.6% |
| Range | 55.5% | 45.5% |
| Mean | 17.3% | 20.2% |
| Median | 15.7% | 18.7% |
| Interquartile 25% (IQ1) | 12.5% | 15.7% |
| Interquartile 75% (IQ3) | 19.6% | 22.9% |
| Interquartile Range (IQR) | 7.1% | 7.2% |
| Standard Deviation (Sample) | 9.9% | 8.1% |
| Standard Deviation (Population) | 9.9% | 8.0% |
Similar Demographics by 3 or more Vehicles in Household
Demographics Similar to Immigrants from Israel by 3 or more Vehicles in Household
In terms of 3 or more vehicles in household, the demographic groups most similar to Immigrants from Israel are Puerto Rican (15.6%, a difference of 0.020%), Immigrants from Belarus (15.5%, a difference of 0.64%), Haitian (15.5%, a difference of 0.96%), Albanian (15.8%, a difference of 1.2%), and U.S. Virgin Islander (15.4%, a difference of 1.5%).
| Demographics | Rating | Rank | 3 or more Vehicles in Household |
| Somalis | 0.0 /100 | #306 | Tragic 16.2% |
| Immigrants | Ghana | 0.0 /100 | #307 | Tragic 16.2% |
| Houma | 0.0 /100 | #308 | Tragic 16.1% |
| Immigrants | Somalia | 0.0 /100 | #309 | Tragic 15.9% |
| Moroccans | 0.0 /100 | #310 | Tragic 15.9% |
| Albanians | 0.0 /100 | #311 | Tragic 15.8% |
| Puerto Ricans | 0.0 /100 | #312 | Tragic 15.6% |
| Immigrants | Israel | 0.0 /100 | #313 | Tragic 15.6% |
| Immigrants | Belarus | 0.0 /100 | #314 | Tragic 15.5% |
| Haitians | 0.0 /100 | #315 | Tragic 15.5% |
| U.S. Virgin Islanders | 0.0 /100 | #316 | Tragic 15.4% |
| Jamaicans | 0.0 /100 | #317 | Tragic 15.2% |
| Immigrants | Haiti | 0.0 /100 | #318 | Tragic 15.2% |
| Cape Verdeans | 0.0 /100 | #319 | Tragic 15.0% |
| Yup'ik | 0.0 /100 | #320 | Tragic 14.8% |
Demographics Similar to Indonesians by 3 or more Vehicles in Household
In terms of 3 or more vehicles in household, the demographic groups most similar to Indonesians are Immigrants from Malaysia (18.3%, a difference of 0.040%), Sierra Leonean (18.3%, a difference of 0.23%), Immigrants from Honduras (18.2%, a difference of 0.23%), Immigrants from Middle Africa (18.2%, a difference of 0.24%), and Immigrants from China (18.2%, a difference of 0.36%).
| Demographics | Rating | Rank | 3 or more Vehicles in Household |
| Immigrants | Western Asia | 4.8 /100 | #230 | Tragic 18.4% |
| Immigrants | Belgium | 4.8 /100 | #231 | Tragic 18.4% |
| Immigrants | Uganda | 4.6 /100 | #232 | Tragic 18.4% |
| Hondurans | 4.6 /100 | #233 | Tragic 18.4% |
| Immigrants | North Macedonia | 4.4 /100 | #234 | Tragic 18.4% |
| Sierra Leoneans | 3.9 /100 | #235 | Tragic 18.3% |
| Immigrants | Malaysia | 3.6 /100 | #236 | Tragic 18.3% |
| Indonesians | 3.5 /100 | #237 | Tragic 18.3% |
| Immigrants | Honduras | 3.1 /100 | #238 | Tragic 18.2% |
| Immigrants | Middle Africa | 3.1 /100 | #239 | Tragic 18.2% |
| Immigrants | China | 2.9 /100 | #240 | Tragic 18.2% |
| Africans | 2.7 /100 | #241 | Tragic 18.2% |
| Hopi | 2.5 /100 | #242 | Tragic 18.2% |
| Immigrants | Europe | 2.4 /100 | #243 | Tragic 18.1% |
| Mongolians | 2.3 /100 | #244 | Tragic 18.1% |