Immigrants from Afghanistan vs Bhutanese 3 or more Vehicles in Household
COMPARE
Immigrants from Afghanistan
Bhutanese
3 or more Vehicles in Household
3 or more Vehicles in Household Comparison
Immigrants from Afghanistan
Bhutanese
21.2%
3 OR MORE VEHICLES IN HOUSEHOLD
99.1/ 100
METRIC RATING
90th/ 347
METRIC RANK
22.2%
3 OR MORE VEHICLES IN HOUSEHOLD
99.9/ 100
METRIC RATING
61st/ 347
METRIC RANK
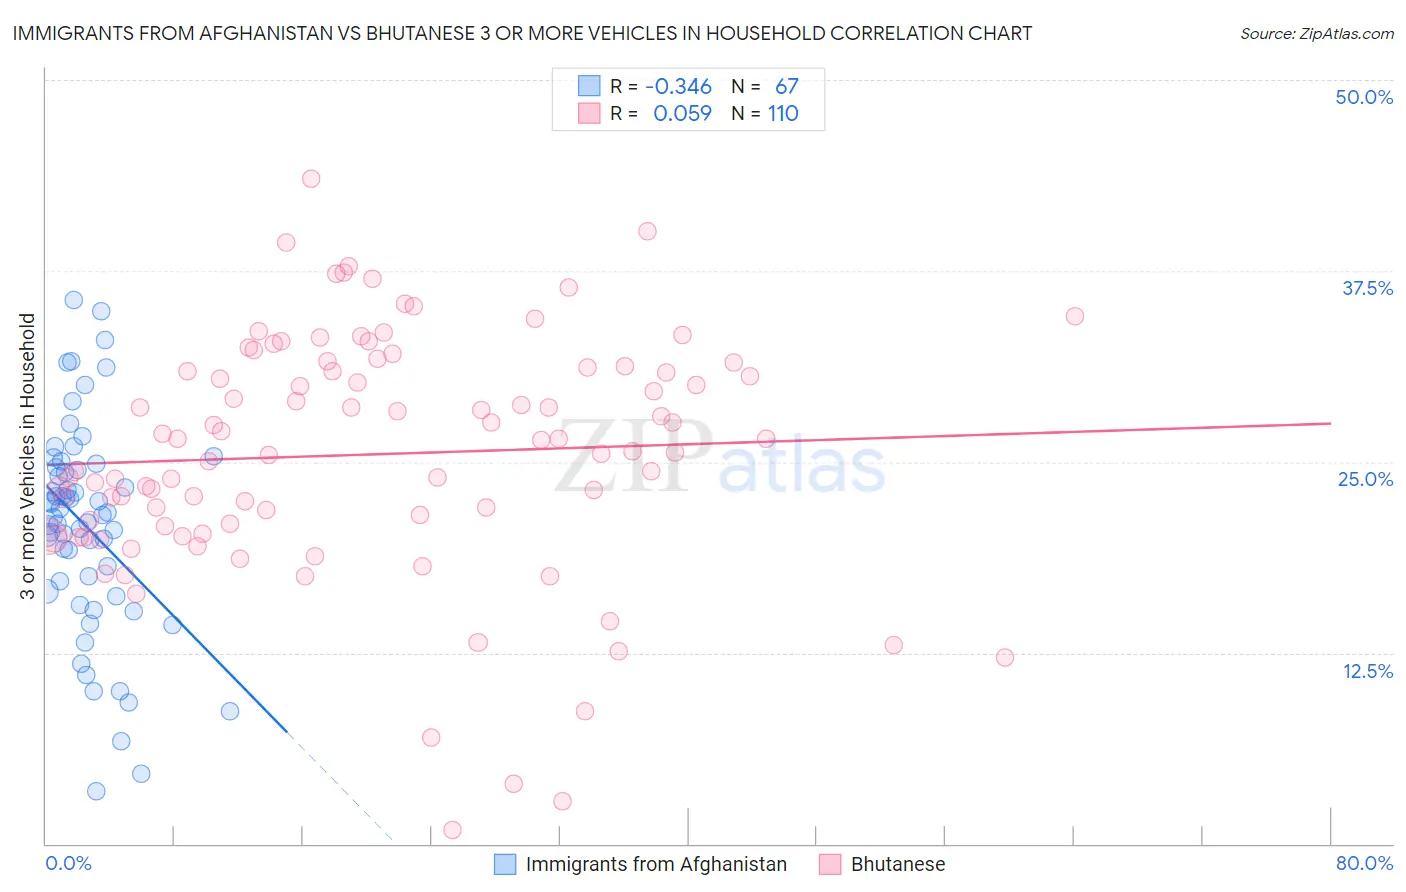
Immigrants from Afghanistan vs Bhutanese 3 or more Vehicles in Household Correlation Chart
The statistical analysis conducted on geographies consisting of 147,579,076 people shows a mild negative correlation between the proportion of Immigrants from Afghanistan and percentage of households with 3 or more vehicles available in the United States with a correlation coefficient (R) of -0.346 and weighted average of 21.2%. Similarly, the statistical analysis conducted on geographies consisting of 454,966,452 people shows a slight positive correlation between the proportion of Bhutanese and percentage of households with 3 or more vehicles available in the United States with a correlation coefficient (R) of 0.059 and weighted average of 22.2%, a difference of 4.7%.
3 or more Vehicles in Household Correlation Summary
| Measurement | Immigrants from Afghanistan | Bhutanese |
| Minimum | 3.4% | 0.93% |
| Maximum | 35.6% | 43.5% |
| Range | 32.2% | 42.6% |
| Mean | 20.7% | 25.5% |
| Median | 21.5% | 26.1% |
| Interquartile 25% (IQ1) | 16.5% | 20.7% |
| Interquartile 75% (IQ3) | 24.6% | 31.2% |
| Interquartile Range (IQR) | 8.1% | 10.4% |
| Standard Deviation (Sample) | 6.9% | 7.9% |
| Standard Deviation (Population) | 6.8% | 7.9% |
Similar Demographics by 3 or more Vehicles in Household
Demographics Similar to Immigrants from Afghanistan by 3 or more Vehicles in Household
In terms of 3 or more vehicles in household, the demographic groups most similar to Immigrants from Afghanistan are Marshallese (21.3%, a difference of 0.22%), Belgian (21.2%, a difference of 0.33%), Apache (21.2%, a difference of 0.41%), Immigrants from Indonesia (21.1%, a difference of 0.61%), and French (21.4%, a difference of 0.78%).
| Demographics | Rating | Rank | 3 or more Vehicles in Household |
| Chippewa | 99.6 /100 | #83 | Exceptional 21.5% |
| Icelanders | 99.6 /100 | #84 | Exceptional 21.5% |
| Laotians | 99.6 /100 | #85 | Exceptional 21.5% |
| Delaware | 99.6 /100 | #86 | Exceptional 21.5% |
| Immigrants | Azores | 99.5 /100 | #87 | Exceptional 21.5% |
| French | 99.4 /100 | #88 | Exceptional 21.4% |
| Marshallese | 99.2 /100 | #89 | Exceptional 21.3% |
| Immigrants | Afghanistan | 99.1 /100 | #90 | Exceptional 21.2% |
| Belgians | 98.9 /100 | #91 | Exceptional 21.2% |
| Apache | 98.9 /100 | #92 | Exceptional 21.2% |
| Immigrants | Indonesia | 98.8 /100 | #93 | Exceptional 21.1% |
| Immigrants | Cambodia | 98.6 /100 | #94 | Exceptional 21.1% |
| Pakistanis | 98.5 /100 | #95 | Exceptional 21.0% |
| Cree | 98.4 /100 | #96 | Exceptional 21.0% |
| Canadians | 98.3 /100 | #97 | Exceptional 21.0% |
Demographics Similar to Bhutanese by 3 or more Vehicles in Household
In terms of 3 or more vehicles in household, the demographic groups most similar to Bhutanese are Fijian (22.2%, a difference of 0.040%), Finnish (22.3%, a difference of 0.16%), Chickasaw (22.2%, a difference of 0.20%), Navajo (22.3%, a difference of 0.24%), and Spaniard (22.3%, a difference of 0.30%).
| Demographics | Rating | Rank | 3 or more Vehicles in Household |
| Crow | 100.0 /100 | #54 | Exceptional 22.5% |
| Immigrants | Laos | 100.0 /100 | #55 | Exceptional 22.4% |
| Hispanics or Latinos | 100.0 /100 | #56 | Exceptional 22.4% |
| Pennsylvania Germans | 100.0 /100 | #57 | Exceptional 22.3% |
| Spaniards | 100.0 /100 | #58 | Exceptional 22.3% |
| Navajo | 100.0 /100 | #59 | Exceptional 22.3% |
| Finns | 99.9 /100 | #60 | Exceptional 22.3% |
| Bhutanese | 99.9 /100 | #61 | Exceptional 22.2% |
| Fijians | 99.9 /100 | #62 | Exceptional 22.2% |
| Chickasaw | 99.9 /100 | #63 | Exceptional 22.2% |
| Immigrants | Taiwan | 99.9 /100 | #64 | Exceptional 22.1% |
| Pima | 99.9 /100 | #65 | Exceptional 22.0% |
| Northern Europeans | 99.9 /100 | #66 | Exceptional 22.0% |
| Alaskan Athabascans | 99.9 /100 | #67 | Exceptional 21.9% |
| British | 99.9 /100 | #68 | Exceptional 21.9% |