Immigrants from Guyana vs Bermudan 3 or more Vehicles in Household
COMPARE
Immigrants from Guyana
Bermudan
3 or more Vehicles in Household
3 or more Vehicles in Household Comparison
Immigrants from Guyana
Bermudans
11.2%
3 OR MORE VEHICLES IN HOUSEHOLD
0.0/ 100
METRIC RATING
343rd/ 347
METRIC RANK
17.8%
3 OR MORE VEHICLES IN HOUSEHOLD
0.9/ 100
METRIC RATING
263rd/ 347
METRIC RANK
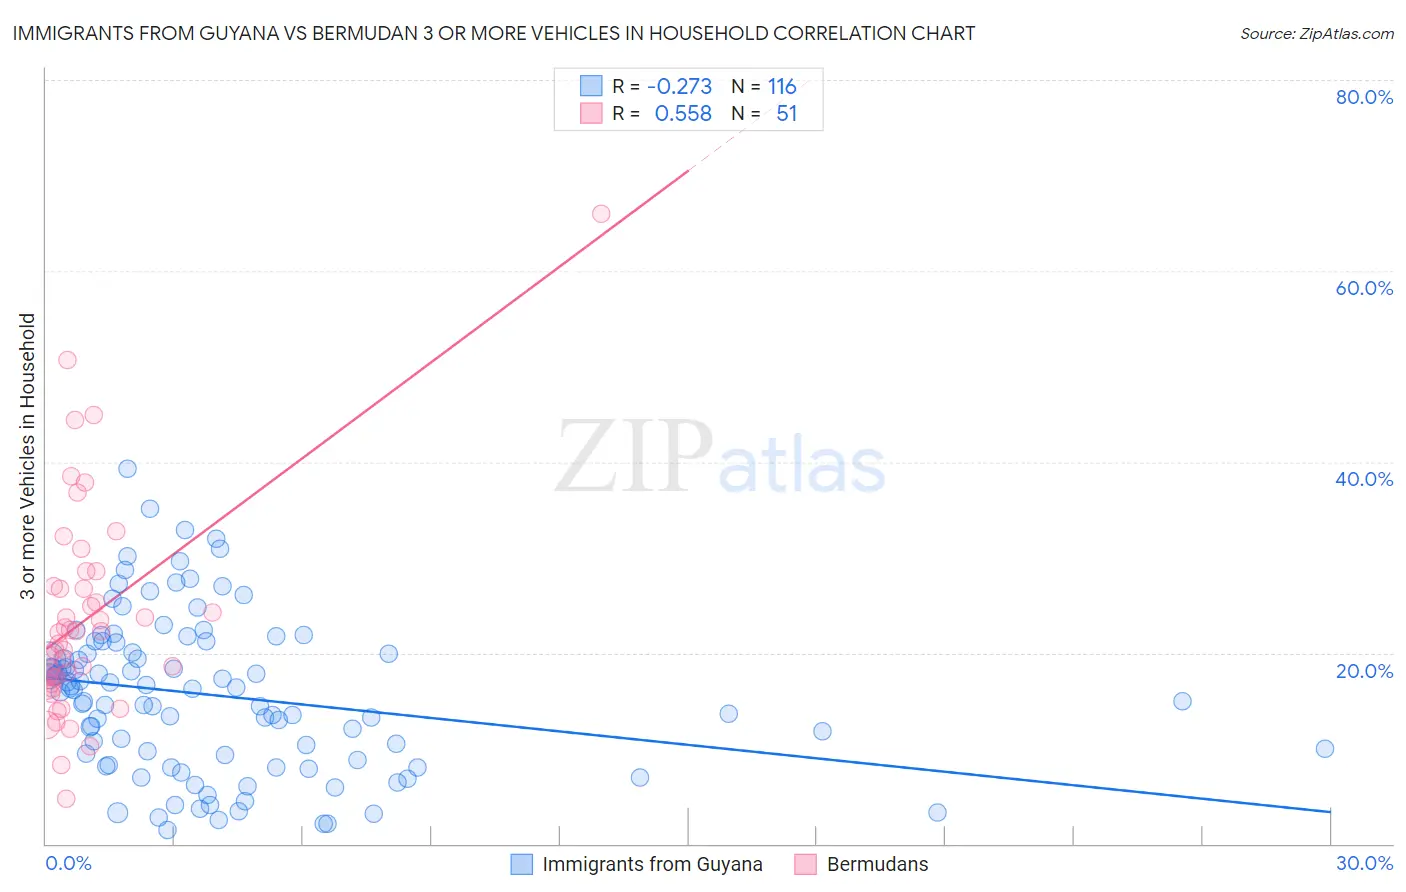
Immigrants from Guyana vs Bermudan 3 or more Vehicles in Household Correlation Chart
The statistical analysis conducted on geographies consisting of 183,650,953 people shows a weak negative correlation between the proportion of Immigrants from Guyana and percentage of households with 3 or more vehicles available in the United States with a correlation coefficient (R) of -0.273 and weighted average of 11.2%. Similarly, the statistical analysis conducted on geographies consisting of 55,710,520 people shows a substantial positive correlation between the proportion of Bermudans and percentage of households with 3 or more vehicles available in the United States with a correlation coefficient (R) of 0.558 and weighted average of 17.8%, a difference of 58.0%.
3 or more Vehicles in Household Correlation Summary
| Measurement | Immigrants from Guyana | Bermudan |
| Minimum | 1.4% | 4.8% |
| Maximum | 39.2% | 66.0% |
| Range | 37.8% | 61.2% |
| Mean | 15.5% | 23.6% |
| Median | 16.2% | 22.1% |
| Interquartile 25% (IQ1) | 9.0% | 16.7% |
| Interquartile 75% (IQ3) | 20.5% | 27.0% |
| Interquartile Range (IQR) | 11.5% | 10.3% |
| Standard Deviation (Sample) | 8.1% | 11.2% |
| Standard Deviation (Population) | 8.1% | 11.1% |
Similar Demographics by 3 or more Vehicles in Household
Demographics Similar to Immigrants from Guyana by 3 or more Vehicles in Household
In terms of 3 or more vehicles in household, the demographic groups most similar to Immigrants from Guyana are Dominican (11.2%, a difference of 0.15%), British West Indian (11.4%, a difference of 1.8%), Guyanese (11.5%, a difference of 1.9%), Immigrants from Barbados (11.7%, a difference of 4.3%), and Immigrants from Uzbekistan (12.0%, a difference of 6.6%).
| Demographics | Rating | Rank | 3 or more Vehicles in Household |
| Immigrants | Cabo Verde | 0.0 /100 | #333 | Tragic 13.6% |
| Immigrants | Ecuador | 0.0 /100 | #334 | Tragic 13.4% |
| Immigrants | Trinidad and Tobago | 0.0 /100 | #335 | Tragic 13.3% |
| Barbadians | 0.0 /100 | #336 | Tragic 12.6% |
| Immigrants | Bangladesh | 0.0 /100 | #337 | Tragic 12.5% |
| Vietnamese | 0.0 /100 | #338 | Tragic 12.5% |
| Immigrants | Uzbekistan | 0.0 /100 | #339 | Tragic 12.0% |
| Immigrants | Barbados | 0.0 /100 | #340 | Tragic 11.7% |
| Guyanese | 0.0 /100 | #341 | Tragic 11.5% |
| British West Indians | 0.0 /100 | #342 | Tragic 11.4% |
| Immigrants | Guyana | 0.0 /100 | #343 | Tragic 11.2% |
| Dominicans | 0.0 /100 | #344 | Tragic 11.2% |
| Immigrants | Dominican Republic | 0.0 /100 | #345 | Tragic 10.4% |
| Immigrants | St. Vincent and the Grenadines | 0.0 /100 | #346 | Tragic 10.1% |
| Immigrants | Grenada | 0.0 /100 | #347 | Tragic 9.1% |
Demographics Similar to Bermudans by 3 or more Vehicles in Household
In terms of 3 or more vehicles in household, the demographic groups most similar to Bermudans are Cambodian (17.8%, a difference of 0.030%), Colombian (17.8%, a difference of 0.11%), Immigrants from Northern Africa (17.8%, a difference of 0.14%), Ugandan (17.8%, a difference of 0.16%), and Immigrants from Panama (17.7%, a difference of 0.16%).
| Demographics | Rating | Rank | 3 or more Vehicles in Household |
| Sub-Saharan Africans | 1.1 /100 | #256 | Tragic 17.9% |
| Immigrants | Eritrea | 1.1 /100 | #257 | Tragic 17.8% |
| Sudanese | 1.1 /100 | #258 | Tragic 17.8% |
| Uruguayans | 1.0 /100 | #259 | Tragic 17.8% |
| Ugandans | 0.9 /100 | #260 | Tragic 17.8% |
| Immigrants | Northern Africa | 0.9 /100 | #261 | Tragic 17.8% |
| Colombians | 0.9 /100 | #262 | Tragic 17.8% |
| Bermudans | 0.9 /100 | #263 | Tragic 17.8% |
| Cambodians | 0.9 /100 | #264 | Tragic 17.8% |
| Immigrants | Panama | 0.8 /100 | #265 | Tragic 17.7% |
| Macedonians | 0.8 /100 | #266 | Tragic 17.7% |
| Immigrants | Venezuela | 0.8 /100 | #267 | Tragic 17.7% |
| Immigrants | Bulgaria | 0.8 /100 | #268 | Tragic 17.7% |
| Immigrants | France | 0.6 /100 | #269 | Tragic 17.6% |
| Immigrants | Nepal | 0.6 /100 | #270 | Tragic 17.6% |