Immigrants from Guyana vs Immigrants from Korea Child Poverty Under the Age of 16
COMPARE
Immigrants from Guyana
Immigrants from Korea
Child Poverty Under the Age of 16
Child Poverty Under the Age of 16 Comparison
Immigrants from Guyana
Immigrants from Korea
19.4%
CHILD POVERTY UNDER THE AGE OF 16
0.1/ 100
METRIC RATING
262nd/ 347
METRIC RANK
13.0%
CHILD POVERTY UNDER THE AGE OF 16
99.9/ 100
METRIC RATING
15th/ 347
METRIC RANK
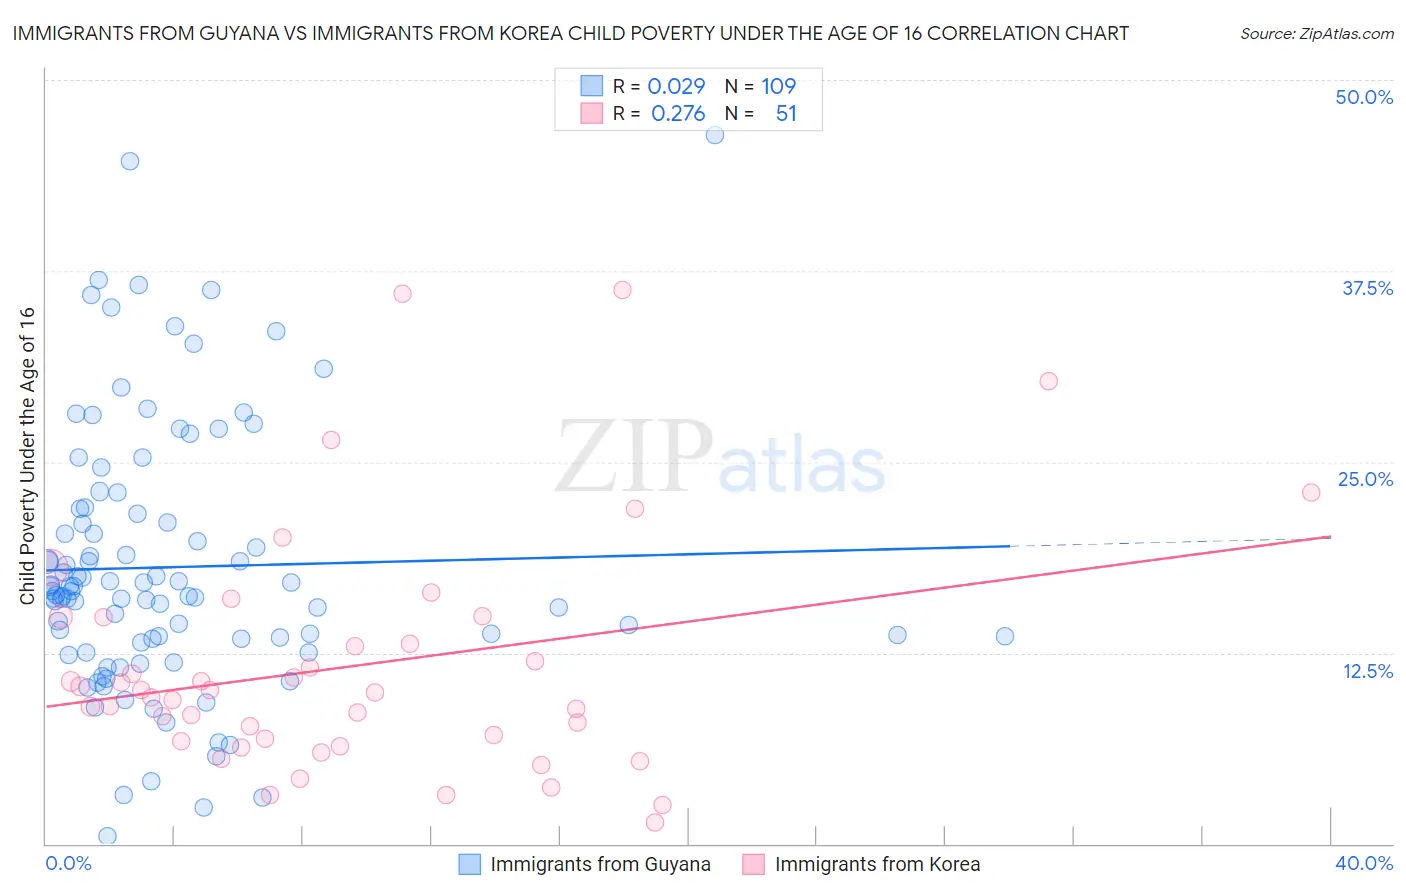
Immigrants from Guyana vs Immigrants from Korea Child Poverty Under the Age of 16 Correlation Chart
The statistical analysis conducted on geographies consisting of 182,901,367 people shows no correlation between the proportion of Immigrants from Guyana and poverty level among children under the age of 16 in the United States with a correlation coefficient (R) of 0.029 and weighted average of 19.4%. Similarly, the statistical analysis conducted on geographies consisting of 411,757,414 people shows a weak positive correlation between the proportion of Immigrants from Korea and poverty level among children under the age of 16 in the United States with a correlation coefficient (R) of 0.276 and weighted average of 13.0%, a difference of 49.5%.
Child Poverty Under the Age of 16 Correlation Summary
| Measurement | Immigrants from Guyana | Immigrants from Korea |
| Minimum | 0.46% | 1.4% |
| Maximum | 46.4% | 36.3% |
| Range | 45.9% | 34.9% |
| Mean | 18.1% | 11.6% |
| Median | 16.5% | 9.9% |
| Interquartile 25% (IQ1) | 13.3% | 6.7% |
| Interquartile 75% (IQ3) | 21.7% | 14.8% |
| Interquartile Range (IQR) | 8.5% | 8.1% |
| Standard Deviation (Sample) | 8.7% | 7.8% |
| Standard Deviation (Population) | 8.6% | 7.7% |
Similar Demographics by Child Poverty Under the Age of 16
Demographics Similar to Immigrants from Guyana by Child Poverty Under the Age of 16
In terms of child poverty under the age of 16, the demographic groups most similar to Immigrants from Guyana are Immigrants from Burma/Myanmar (19.4%, a difference of 0.040%), Guyanese (19.3%, a difference of 0.12%), Mexican American Indian (19.3%, a difference of 0.22%), Vietnamese (19.4%, a difference of 0.32%), and Immigrants from Ecuador (19.4%, a difference of 0.38%).
| Demographics | Rating | Rank | Child Poverty Under the Age of 16 |
| Trinidadians and Tobagonians | 0.2 /100 | #255 | Tragic 19.2% |
| Inupiat | 0.2 /100 | #256 | Tragic 19.2% |
| Ottawa | 0.2 /100 | #257 | Tragic 19.2% |
| Spanish Americans | 0.2 /100 | #258 | Tragic 19.2% |
| Mexican American Indians | 0.2 /100 | #259 | Tragic 19.3% |
| Guyanese | 0.2 /100 | #260 | Tragic 19.3% |
| Immigrants | Burma/Myanmar | 0.1 /100 | #261 | Tragic 19.4% |
| Immigrants | Guyana | 0.1 /100 | #262 | Tragic 19.4% |
| Vietnamese | 0.1 /100 | #263 | Tragic 19.4% |
| Immigrants | Ecuador | 0.1 /100 | #264 | Tragic 19.4% |
| Chickasaw | 0.1 /100 | #265 | Tragic 19.5% |
| Liberians | 0.1 /100 | #266 | Tragic 19.5% |
| Cherokee | 0.1 /100 | #267 | Tragic 19.5% |
| Jamaicans | 0.1 /100 | #268 | Tragic 19.7% |
| Immigrants | El Salvador | 0.1 /100 | #269 | Tragic 19.7% |
Demographics Similar to Immigrants from Korea by Child Poverty Under the Age of 16
In terms of child poverty under the age of 16, the demographic groups most similar to Immigrants from Korea are Norwegian (13.0%, a difference of 0.050%), Bulgarian (13.0%, a difference of 0.27%), Immigrants from Lithuania (12.9%, a difference of 0.31%), Cypriot (13.0%, a difference of 0.69%), and Immigrants from Japan (13.0%, a difference of 0.73%).
| Demographics | Rating | Rank | Child Poverty Under the Age of 16 |
| Immigrants | Singapore | 100.0 /100 | #8 | Exceptional 12.4% |
| Immigrants | Iran | 100.0 /100 | #9 | Exceptional 12.4% |
| Immigrants | South Central Asia | 99.9 /100 | #10 | Exceptional 12.5% |
| Bhutanese | 99.9 /100 | #11 | Exceptional 12.5% |
| Immigrants | Ireland | 99.9 /100 | #12 | Exceptional 12.7% |
| Burmese | 99.9 /100 | #13 | Exceptional 12.8% |
| Immigrants | Lithuania | 99.9 /100 | #14 | Exceptional 12.9% |
| Immigrants | Korea | 99.9 /100 | #15 | Exceptional 13.0% |
| Norwegians | 99.9 /100 | #16 | Exceptional 13.0% |
| Bulgarians | 99.9 /100 | #17 | Exceptional 13.0% |
| Cypriots | 99.9 /100 | #18 | Exceptional 13.0% |
| Immigrants | Japan | 99.8 /100 | #19 | Exceptional 13.0% |
| Okinawans | 99.8 /100 | #20 | Exceptional 13.1% |
| Immigrants | Eastern Asia | 99.8 /100 | #21 | Exceptional 13.1% |
| Maltese | 99.8 /100 | #22 | Exceptional 13.1% |