Immigrants from Guyana vs Immigrants from El Salvador 3 or more Vehicles in Household
COMPARE
Immigrants from Guyana
Immigrants from El Salvador
3 or more Vehicles in Household
3 or more Vehicles in Household Comparison
Immigrants from Guyana
Immigrants from El Salvador
11.2%
3 OR MORE VEHICLES IN HOUSEHOLD
0.0/ 100
METRIC RATING
343rd/ 347
METRIC RANK
21.5%
3 OR MORE VEHICLES IN HOUSEHOLD
99.6/ 100
METRIC RATING
82nd/ 347
METRIC RANK
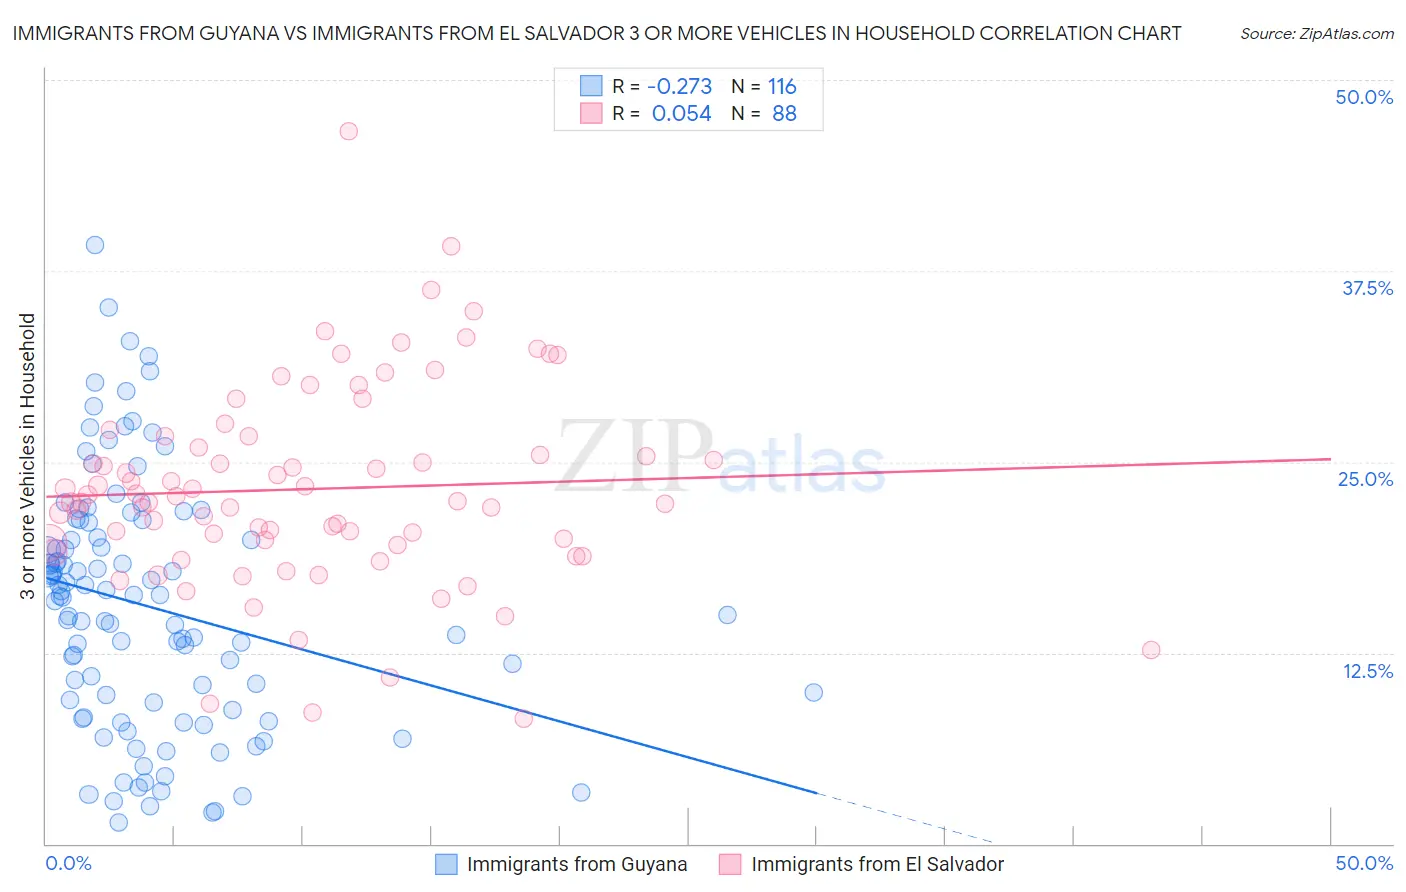
Immigrants from Guyana vs Immigrants from El Salvador 3 or more Vehicles in Household Correlation Chart
The statistical analysis conducted on geographies consisting of 183,650,953 people shows a weak negative correlation between the proportion of Immigrants from Guyana and percentage of households with 3 or more vehicles available in the United States with a correlation coefficient (R) of -0.273 and weighted average of 11.2%. Similarly, the statistical analysis conducted on geographies consisting of 357,687,978 people shows a slight positive correlation between the proportion of Immigrants from El Salvador and percentage of households with 3 or more vehicles available in the United States with a correlation coefficient (R) of 0.054 and weighted average of 21.5%, a difference of 91.5%.
3 or more Vehicles in Household Correlation Summary
| Measurement | Immigrants from Guyana | Immigrants from El Salvador |
| Minimum | 1.4% | 8.2% |
| Maximum | 39.2% | 46.7% |
| Range | 37.8% | 38.5% |
| Mean | 15.5% | 23.2% |
| Median | 16.2% | 22.4% |
| Interquartile 25% (IQ1) | 9.0% | 19.7% |
| Interquartile 75% (IQ3) | 20.5% | 26.3% |
| Interquartile Range (IQR) | 11.5% | 6.7% |
| Standard Deviation (Sample) | 8.1% | 6.6% |
| Standard Deviation (Population) | 8.1% | 6.6% |
Similar Demographics by 3 or more Vehicles in Household
Demographics Similar to Immigrants from Guyana by 3 or more Vehicles in Household
In terms of 3 or more vehicles in household, the demographic groups most similar to Immigrants from Guyana are Dominican (11.2%, a difference of 0.15%), British West Indian (11.4%, a difference of 1.8%), Guyanese (11.5%, a difference of 1.9%), Immigrants from Barbados (11.7%, a difference of 4.3%), and Immigrants from Uzbekistan (12.0%, a difference of 6.6%).
| Demographics | Rating | Rank | 3 or more Vehicles in Household |
| Immigrants | Cabo Verde | 0.0 /100 | #333 | Tragic 13.6% |
| Immigrants | Ecuador | 0.0 /100 | #334 | Tragic 13.4% |
| Immigrants | Trinidad and Tobago | 0.0 /100 | #335 | Tragic 13.3% |
| Barbadians | 0.0 /100 | #336 | Tragic 12.6% |
| Immigrants | Bangladesh | 0.0 /100 | #337 | Tragic 12.5% |
| Vietnamese | 0.0 /100 | #338 | Tragic 12.5% |
| Immigrants | Uzbekistan | 0.0 /100 | #339 | Tragic 12.0% |
| Immigrants | Barbados | 0.0 /100 | #340 | Tragic 11.7% |
| Guyanese | 0.0 /100 | #341 | Tragic 11.5% |
| British West Indians | 0.0 /100 | #342 | Tragic 11.4% |
| Immigrants | Guyana | 0.0 /100 | #343 | Tragic 11.2% |
| Dominicans | 0.0 /100 | #344 | Tragic 11.2% |
| Immigrants | Dominican Republic | 0.0 /100 | #345 | Tragic 10.4% |
| Immigrants | St. Vincent and the Grenadines | 0.0 /100 | #346 | Tragic 10.1% |
| Immigrants | Grenada | 0.0 /100 | #347 | Tragic 9.1% |
Demographics Similar to Immigrants from El Salvador by 3 or more Vehicles in Household
In terms of 3 or more vehicles in household, the demographic groups most similar to Immigrants from El Salvador are Chippewa (21.5%, a difference of 0.030%), Icelander (21.5%, a difference of 0.080%), Laotian (21.5%, a difference of 0.10%), Delaware (21.5%, a difference of 0.17%), and Immigrants from the Azores (21.5%, a difference of 0.29%).
| Demographics | Rating | Rank | 3 or more Vehicles in Household |
| Japanese | 99.8 /100 | #75 | Exceptional 21.8% |
| Immigrants | Nonimmigrants | 99.8 /100 | #76 | Exceptional 21.8% |
| Irish | 99.8 /100 | #77 | Exceptional 21.8% |
| Czechoslovakians | 99.8 /100 | #78 | Exceptional 21.7% |
| Assyrians/Chaldeans/Syriacs | 99.8 /100 | #79 | Exceptional 21.7% |
| Afghans | 99.7 /100 | #80 | Exceptional 21.7% |
| Celtics | 99.7 /100 | #81 | Exceptional 21.7% |
| Immigrants | El Salvador | 99.6 /100 | #82 | Exceptional 21.5% |
| Chippewa | 99.6 /100 | #83 | Exceptional 21.5% |
| Icelanders | 99.6 /100 | #84 | Exceptional 21.5% |
| Laotians | 99.6 /100 | #85 | Exceptional 21.5% |
| Delaware | 99.6 /100 | #86 | Exceptional 21.5% |
| Immigrants | Azores | 99.5 /100 | #87 | Exceptional 21.5% |
| French | 99.4 /100 | #88 | Exceptional 21.4% |
| Marshallese | 99.2 /100 | #89 | Exceptional 21.3% |