Immigrants from Guatemala vs Spaniard 4 or more Vehicles in Household
COMPARE
Immigrants from Guatemala
Spaniard
4 or more Vehicles in Household
4 or more Vehicles in Household Comparison
Immigrants from Guatemala
Spaniards
6.8%
4 OR MORE VEHICLES IN HOUSEHOLD
95.8/ 100
METRIC RATING
116th/ 347
METRIC RANK
7.6%
4 OR MORE VEHICLES IN HOUSEHOLD
100.0/ 100
METRIC RATING
60th/ 347
METRIC RANK
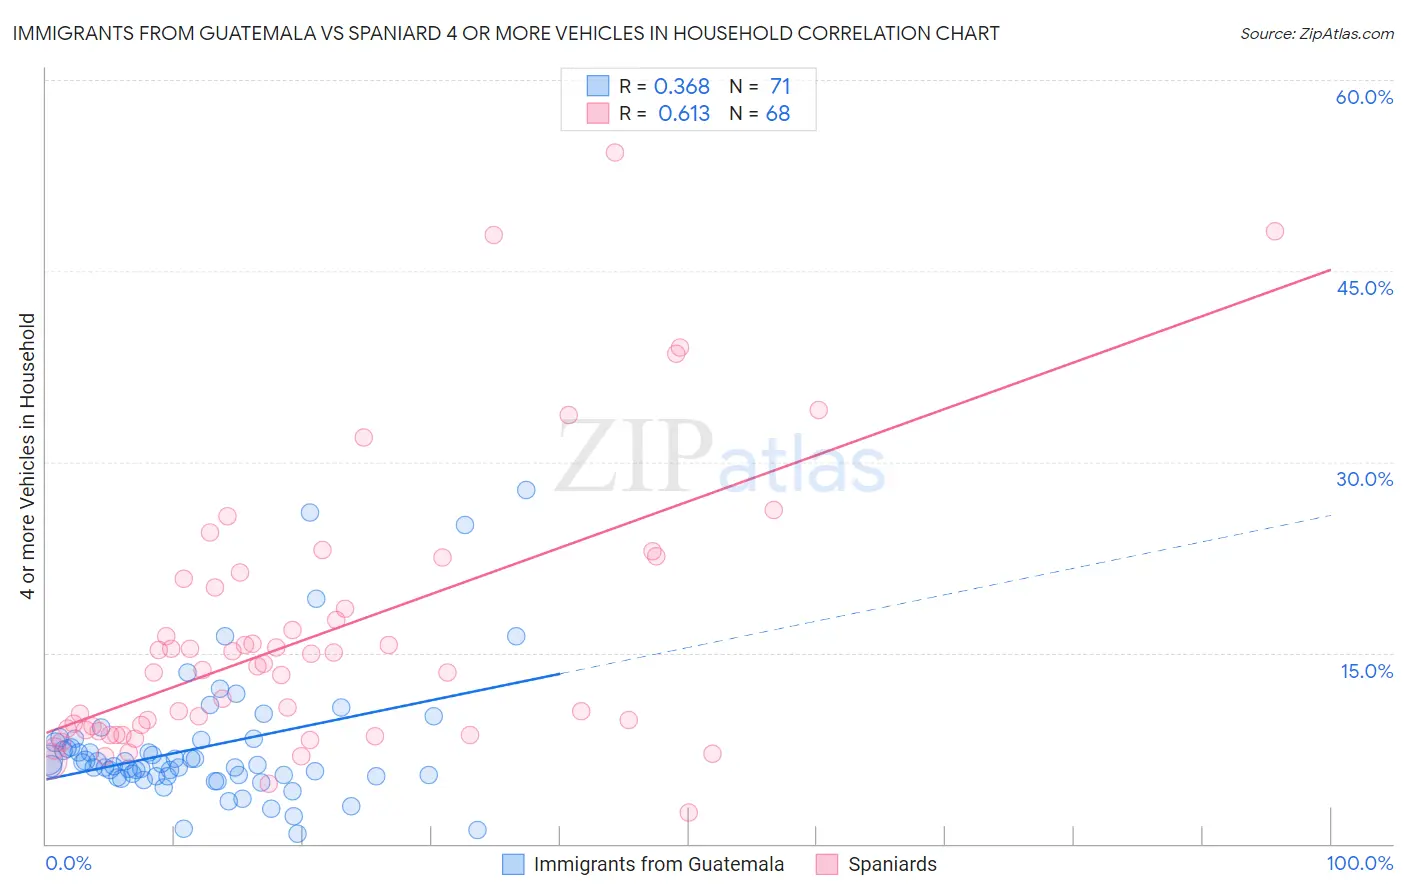
Immigrants from Guatemala vs Spaniard 4 or more Vehicles in Household Correlation Chart
The statistical analysis conducted on geographies consisting of 375,931,655 people shows a mild positive correlation between the proportion of Immigrants from Guatemala and percentage of households with 4 or more vehicles available in the United States with a correlation coefficient (R) of 0.368 and weighted average of 6.8%. Similarly, the statistical analysis conducted on geographies consisting of 441,319,391 people shows a significant positive correlation between the proportion of Spaniards and percentage of households with 4 or more vehicles available in the United States with a correlation coefficient (R) of 0.613 and weighted average of 7.6%, a difference of 11.5%.
4 or more Vehicles in Household Correlation Summary
| Measurement | Immigrants from Guatemala | Spaniard |
| Minimum | 0.78% | 2.4% |
| Maximum | 27.8% | 54.3% |
| Range | 27.0% | 51.9% |
| Mean | 7.6% | 16.4% |
| Median | 6.1% | 13.8% |
| Interquartile 25% (IQ1) | 5.3% | 8.9% |
| Interquartile 75% (IQ3) | 8.1% | 20.5% |
| Interquartile Range (IQR) | 2.9% | 11.6% |
| Standard Deviation (Sample) | 5.1% | 10.8% |
| Standard Deviation (Population) | 5.1% | 10.7% |
Similar Demographics by 4 or more Vehicles in Household
Demographics Similar to Immigrants from Guatemala by 4 or more Vehicles in Household
In terms of 4 or more vehicles in household, the demographic groups most similar to Immigrants from Guatemala are Burmese (6.8%, a difference of 0.020%), French American Indian (6.8%, a difference of 0.020%), Costa Rican (6.8%, a difference of 0.13%), Tlingit-Haida (6.8%, a difference of 0.26%), and Bolivian (6.8%, a difference of 0.32%).
| Demographics | Rating | Rank | 4 or more Vehicles in Household |
| Filipinos | 97.6 /100 | #109 | Exceptional 6.9% |
| Immigrants | Thailand | 97.0 /100 | #110 | Exceptional 6.9% |
| Aleuts | 97.0 /100 | #111 | Exceptional 6.9% |
| Hopi | 97.0 /100 | #112 | Exceptional 6.9% |
| Canadians | 96.4 /100 | #113 | Exceptional 6.9% |
| Bolivians | 96.3 /100 | #114 | Exceptional 6.8% |
| Tlingit-Haida | 96.2 /100 | #115 | Exceptional 6.8% |
| Immigrants | Guatemala | 95.8 /100 | #116 | Exceptional 6.8% |
| Burmese | 95.7 /100 | #117 | Exceptional 6.8% |
| French American Indians | 95.7 /100 | #118 | Exceptional 6.8% |
| Costa Ricans | 95.5 /100 | #119 | Exceptional 6.8% |
| Comanche | 94.8 /100 | #120 | Exceptional 6.8% |
| Immigrants | Germany | 94.7 /100 | #121 | Exceptional 6.8% |
| Immigrants | Nicaragua | 94.7 /100 | #122 | Exceptional 6.8% |
| Immigrants | Immigrants | 94.6 /100 | #123 | Exceptional 6.8% |
Demographics Similar to Spaniards by 4 or more Vehicles in Household
In terms of 4 or more vehicles in household, the demographic groups most similar to Spaniards are Hispanic or Latino (7.6%, a difference of 0.060%), Pennsylvania German (7.6%, a difference of 0.10%), Swedish (7.6%, a difference of 0.10%), English (7.6%, a difference of 0.22%), and Immigrants from Oceania (7.6%, a difference of 0.24%).
| Demographics | Rating | Rank | 4 or more Vehicles in Household |
| Malaysians | 100.0 /100 | #53 | Exceptional 7.7% |
| Dutch | 100.0 /100 | #54 | Exceptional 7.7% |
| Immigrants | Oceania | 100.0 /100 | #55 | Exceptional 7.6% |
| English | 100.0 /100 | #56 | Exceptional 7.6% |
| Pennsylvania Germans | 100.0 /100 | #57 | Exceptional 7.6% |
| Swedes | 100.0 /100 | #58 | Exceptional 7.6% |
| Hispanics or Latinos | 100.0 /100 | #59 | Exceptional 7.6% |
| Spaniards | 100.0 /100 | #60 | Exceptional 7.6% |
| Europeans | 100.0 /100 | #61 | Exceptional 7.6% |
| Chippewa | 100.0 /100 | #62 | Exceptional 7.6% |
| Immigrants | Micronesia | 100.0 /100 | #63 | Exceptional 7.6% |
| Bangladeshis | 100.0 /100 | #64 | Exceptional 7.6% |
| Immigrants | Azores | 100.0 /100 | #65 | Exceptional 7.5% |
| Immigrants | Taiwan | 99.9 /100 | #66 | Exceptional 7.5% |
| Americans | 99.9 /100 | #67 | Exceptional 7.5% |