Immigrants from Guatemala vs Immigrants from Haiti 4 or more Vehicles in Household
COMPARE
Immigrants from Guatemala
Immigrants from Haiti
4 or more Vehicles in Household
4 or more Vehicles in Household Comparison
Immigrants from Guatemala
Immigrants from Haiti
6.8%
4 OR MORE VEHICLES IN HOUSEHOLD
95.8/ 100
METRIC RATING
116th/ 347
METRIC RANK
4.5%
4 OR MORE VEHICLES IN HOUSEHOLD
0.0/ 100
METRIC RATING
320th/ 347
METRIC RANK
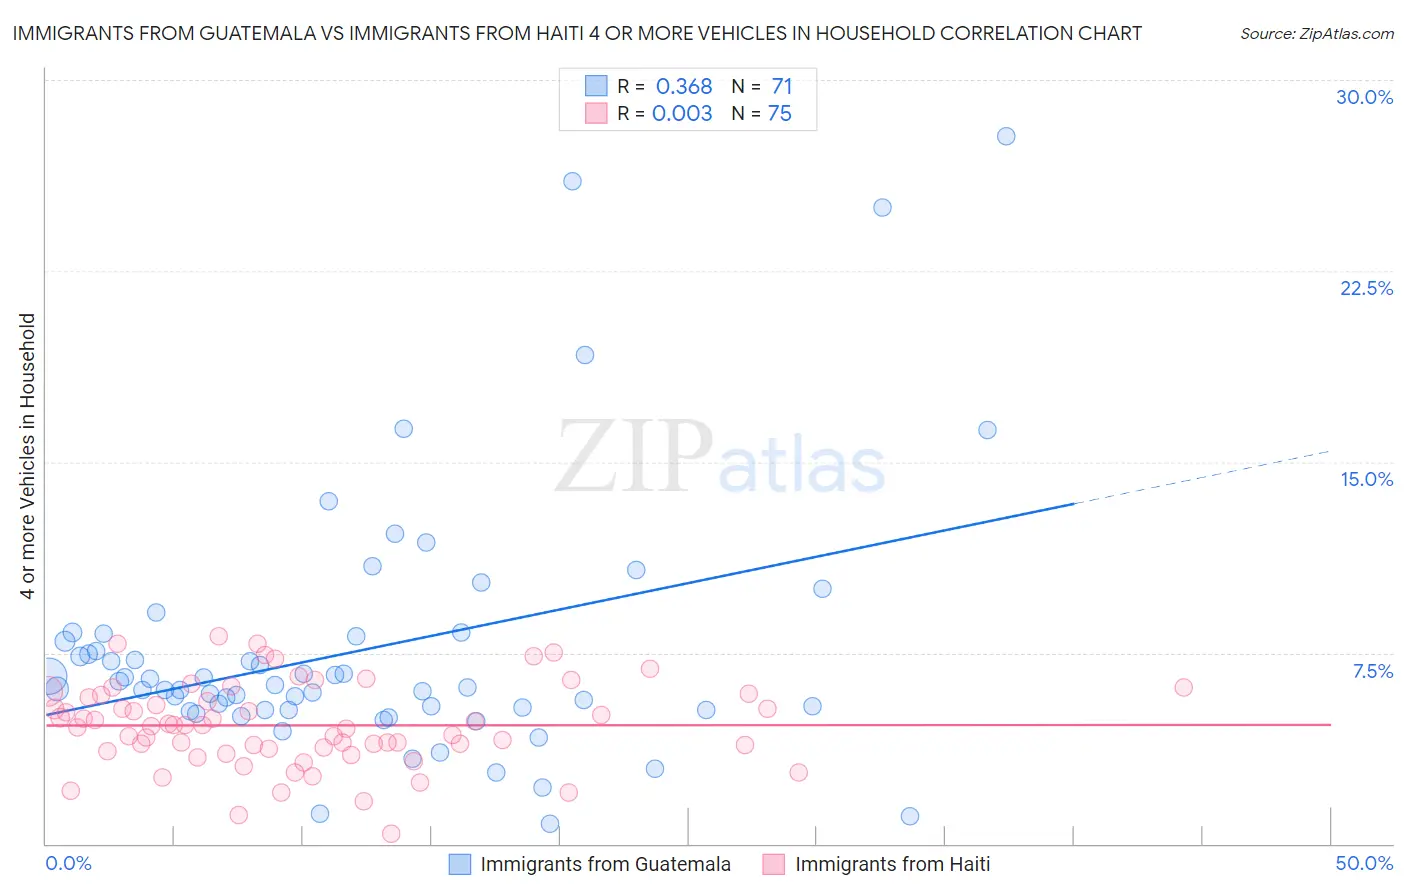
Immigrants from Guatemala vs Immigrants from Haiti 4 or more Vehicles in Household Correlation Chart
The statistical analysis conducted on geographies consisting of 375,931,655 people shows a mild positive correlation between the proportion of Immigrants from Guatemala and percentage of households with 4 or more vehicles available in the United States with a correlation coefficient (R) of 0.368 and weighted average of 6.8%. Similarly, the statistical analysis conducted on geographies consisting of 223,924,769 people shows no correlation between the proportion of Immigrants from Haiti and percentage of households with 4 or more vehicles available in the United States with a correlation coefficient (R) of 0.003 and weighted average of 4.5%, a difference of 51.7%.
4 or more Vehicles in Household Correlation Summary
| Measurement | Immigrants from Guatemala | Immigrants from Haiti |
| Minimum | 0.78% | 0.37% |
| Maximum | 27.8% | 8.2% |
| Range | 27.0% | 7.8% |
| Mean | 7.6% | 4.7% |
| Median | 6.1% | 4.6% |
| Interquartile 25% (IQ1) | 5.3% | 3.7% |
| Interquartile 75% (IQ3) | 8.1% | 5.8% |
| Interquartile Range (IQR) | 2.9% | 2.1% |
| Standard Deviation (Sample) | 5.1% | 1.6% |
| Standard Deviation (Population) | 5.1% | 1.6% |
Similar Demographics by 4 or more Vehicles in Household
Demographics Similar to Immigrants from Guatemala by 4 or more Vehicles in Household
In terms of 4 or more vehicles in household, the demographic groups most similar to Immigrants from Guatemala are Burmese (6.8%, a difference of 0.020%), French American Indian (6.8%, a difference of 0.020%), Costa Rican (6.8%, a difference of 0.13%), Tlingit-Haida (6.8%, a difference of 0.26%), and Bolivian (6.8%, a difference of 0.32%).
| Demographics | Rating | Rank | 4 or more Vehicles in Household |
| Filipinos | 97.6 /100 | #109 | Exceptional 6.9% |
| Immigrants | Thailand | 97.0 /100 | #110 | Exceptional 6.9% |
| Aleuts | 97.0 /100 | #111 | Exceptional 6.9% |
| Hopi | 97.0 /100 | #112 | Exceptional 6.9% |
| Canadians | 96.4 /100 | #113 | Exceptional 6.9% |
| Bolivians | 96.3 /100 | #114 | Exceptional 6.8% |
| Tlingit-Haida | 96.2 /100 | #115 | Exceptional 6.8% |
| Immigrants | Guatemala | 95.8 /100 | #116 | Exceptional 6.8% |
| Burmese | 95.7 /100 | #117 | Exceptional 6.8% |
| French American Indians | 95.7 /100 | #118 | Exceptional 6.8% |
| Costa Ricans | 95.5 /100 | #119 | Exceptional 6.8% |
| Comanche | 94.8 /100 | #120 | Exceptional 6.8% |
| Immigrants | Germany | 94.7 /100 | #121 | Exceptional 6.8% |
| Immigrants | Nicaragua | 94.7 /100 | #122 | Exceptional 6.8% |
| Immigrants | Immigrants | 94.6 /100 | #123 | Exceptional 6.8% |
Demographics Similar to Immigrants from Haiti by 4 or more Vehicles in Household
In terms of 4 or more vehicles in household, the demographic groups most similar to Immigrants from Haiti are Ecuadorian (4.5%, a difference of 0.75%), Immigrants from Yemen (4.5%, a difference of 0.93%), Immigrants from Caribbean (4.4%, a difference of 1.3%), Soviet Union (4.4%, a difference of 1.6%), and Immigrants from Jamaica (4.4%, a difference of 1.9%).
| Demographics | Rating | Rank | 4 or more Vehicles in Household |
| Immigrants | Israel | 0.0 /100 | #313 | Tragic 4.8% |
| Immigrants | West Indies | 0.0 /100 | #314 | Tragic 4.7% |
| Immigrants | Belarus | 0.0 /100 | #315 | Tragic 4.7% |
| Puerto Ricans | 0.0 /100 | #316 | Tragic 4.7% |
| U.S. Virgin Islanders | 0.0 /100 | #317 | Tragic 4.6% |
| Jamaicans | 0.0 /100 | #318 | Tragic 4.6% |
| Haitians | 0.0 /100 | #319 | Tragic 4.6% |
| Immigrants | Haiti | 0.0 /100 | #320 | Tragic 4.5% |
| Ecuadorians | 0.0 /100 | #321 | Tragic 4.5% |
| Immigrants | Yemen | 0.0 /100 | #322 | Tragic 4.5% |
| Immigrants | Caribbean | 0.0 /100 | #323 | Tragic 4.4% |
| Soviet Union | 0.0 /100 | #324 | Tragic 4.4% |
| Immigrants | Jamaica | 0.0 /100 | #325 | Tragic 4.4% |
| Cape Verdeans | 0.0 /100 | #326 | Tragic 4.4% |
| Senegalese | 0.0 /100 | #327 | Tragic 4.3% |