Immigrants from Congo vs Spaniard 4 or more Vehicles in Household
COMPARE
Immigrants from Congo
Spaniard
4 or more Vehicles in Household
4 or more Vehicles in Household Comparison
Immigrants from Congo
Spaniards
5.2%
4 OR MORE VEHICLES IN HOUSEHOLD
0.1/ 100
METRIC RATING
293rd/ 347
METRIC RANK
7.6%
4 OR MORE VEHICLES IN HOUSEHOLD
100.0/ 100
METRIC RATING
60th/ 347
METRIC RANK
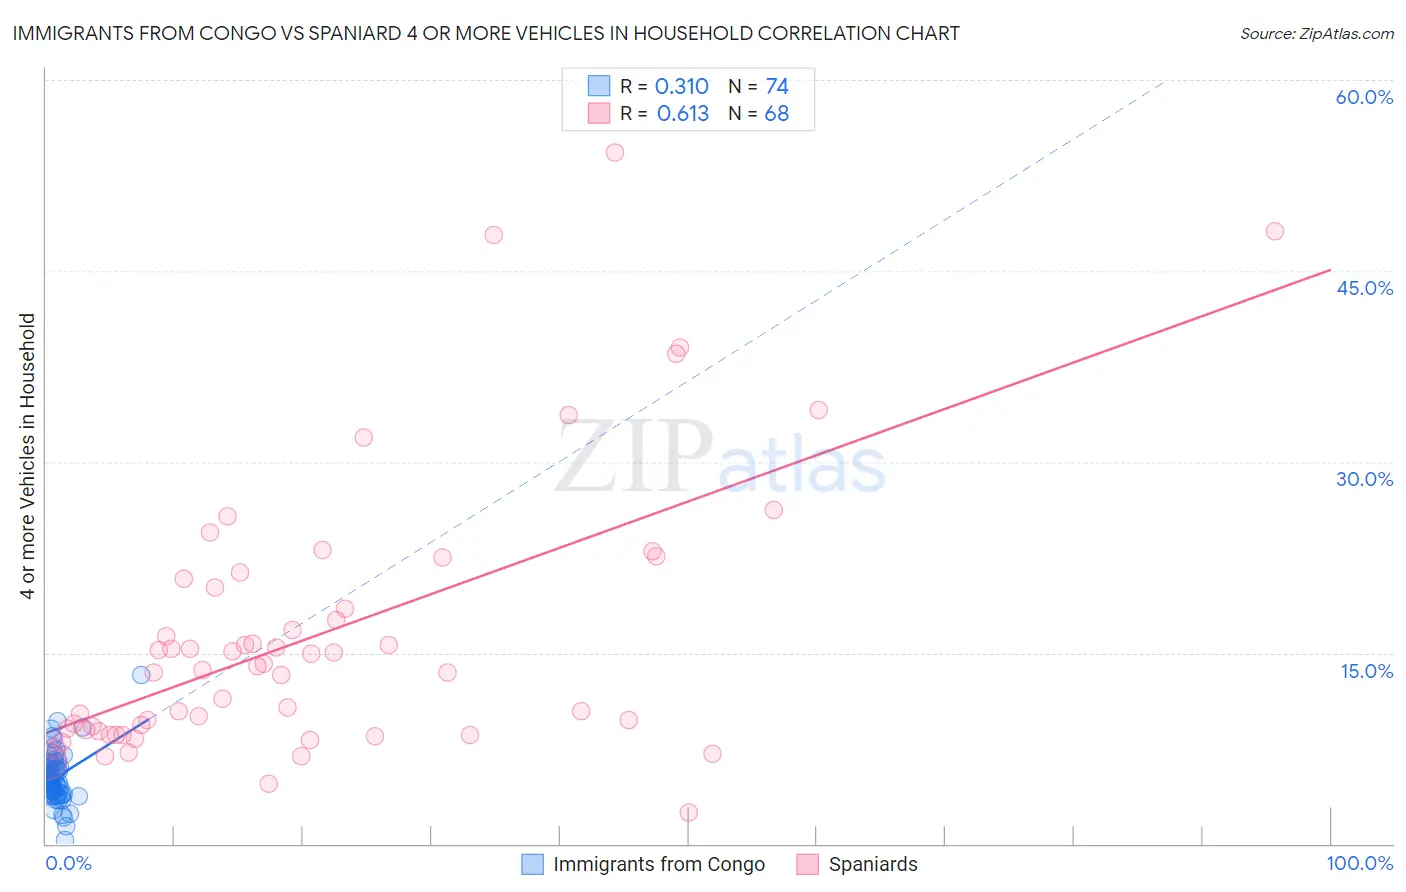
Immigrants from Congo vs Spaniard 4 or more Vehicles in Household Correlation Chart
The statistical analysis conducted on geographies consisting of 92,027,123 people shows a mild positive correlation between the proportion of Immigrants from Congo and percentage of households with 4 or more vehicles available in the United States with a correlation coefficient (R) of 0.310 and weighted average of 5.2%. Similarly, the statistical analysis conducted on geographies consisting of 441,319,391 people shows a significant positive correlation between the proportion of Spaniards and percentage of households with 4 or more vehicles available in the United States with a correlation coefficient (R) of 0.613 and weighted average of 7.6%, a difference of 45.0%.
4 or more Vehicles in Household Correlation Summary
| Measurement | Immigrants from Congo | Spaniard |
| Minimum | 0.25% | 2.4% |
| Maximum | 13.3% | 54.3% |
| Range | 13.0% | 51.9% |
| Mean | 5.2% | 16.4% |
| Median | 5.0% | 13.8% |
| Interquartile 25% (IQ1) | 4.0% | 8.9% |
| Interquartile 75% (IQ3) | 5.9% | 20.5% |
| Interquartile Range (IQR) | 1.9% | 11.6% |
| Standard Deviation (Sample) | 1.9% | 10.8% |
| Standard Deviation (Population) | 1.9% | 10.7% |
Similar Demographics by 4 or more Vehicles in Household
Demographics Similar to Immigrants from Congo by 4 or more Vehicles in Household
In terms of 4 or more vehicles in household, the demographic groups most similar to Immigrants from Congo are Liberian (5.3%, a difference of 0.030%), Ghanaian (5.2%, a difference of 0.050%), Immigrants from Bahamas (5.3%, a difference of 0.13%), Immigrants from Brazil (5.2%, a difference of 0.17%), and Israeli (5.2%, a difference of 0.35%).
| Demographics | Rating | Rank | 4 or more Vehicles in Household |
| Immigrants | Colombia | 0.2 /100 | #286 | Tragic 5.4% |
| Immigrants | Croatia | 0.2 /100 | #287 | Tragic 5.4% |
| Venezuelans | 0.2 /100 | #288 | Tragic 5.3% |
| Immigrants | Bosnia and Herzegovina | 0.2 /100 | #289 | Tragic 5.3% |
| Immigrants | Russia | 0.2 /100 | #290 | Tragic 5.3% |
| Immigrants | Bahamas | 0.1 /100 | #291 | Tragic 5.3% |
| Liberians | 0.1 /100 | #292 | Tragic 5.3% |
| Immigrants | Congo | 0.1 /100 | #293 | Tragic 5.2% |
| Ghanaians | 0.1 /100 | #294 | Tragic 5.2% |
| Immigrants | Brazil | 0.1 /100 | #295 | Tragic 5.2% |
| Israelis | 0.1 /100 | #296 | Tragic 5.2% |
| Immigrants | Venezuela | 0.1 /100 | #297 | Tragic 5.2% |
| Immigrants | South America | 0.1 /100 | #298 | Tragic 5.2% |
| Immigrants | Ghana | 0.1 /100 | #299 | Tragic 5.2% |
| Immigrants | Morocco | 0.0 /100 | #300 | Tragic 5.1% |
Demographics Similar to Spaniards by 4 or more Vehicles in Household
In terms of 4 or more vehicles in household, the demographic groups most similar to Spaniards are Hispanic or Latino (7.6%, a difference of 0.060%), Pennsylvania German (7.6%, a difference of 0.10%), Swedish (7.6%, a difference of 0.10%), English (7.6%, a difference of 0.22%), and Immigrants from Oceania (7.6%, a difference of 0.24%).
| Demographics | Rating | Rank | 4 or more Vehicles in Household |
| Malaysians | 100.0 /100 | #53 | Exceptional 7.7% |
| Dutch | 100.0 /100 | #54 | Exceptional 7.7% |
| Immigrants | Oceania | 100.0 /100 | #55 | Exceptional 7.6% |
| English | 100.0 /100 | #56 | Exceptional 7.6% |
| Pennsylvania Germans | 100.0 /100 | #57 | Exceptional 7.6% |
| Swedes | 100.0 /100 | #58 | Exceptional 7.6% |
| Hispanics or Latinos | 100.0 /100 | #59 | Exceptional 7.6% |
| Spaniards | 100.0 /100 | #60 | Exceptional 7.6% |
| Europeans | 100.0 /100 | #61 | Exceptional 7.6% |
| Chippewa | 100.0 /100 | #62 | Exceptional 7.6% |
| Immigrants | Micronesia | 100.0 /100 | #63 | Exceptional 7.6% |
| Bangladeshis | 100.0 /100 | #64 | Exceptional 7.6% |
| Immigrants | Azores | 100.0 /100 | #65 | Exceptional 7.5% |
| Immigrants | Taiwan | 99.9 /100 | #66 | Exceptional 7.5% |
| Americans | 99.9 /100 | #67 | Exceptional 7.5% |