Inupiat vs Spaniard 4 or more Vehicles in Household
COMPARE
Inupiat
Spaniard
4 or more Vehicles in Household
4 or more Vehicles in Household Comparison
Inupiat
Spaniards
6.2%
4 OR MORE VEHICLES IN HOUSEHOLD
30.7/ 100
METRIC RATING
191st/ 347
METRIC RANK
7.6%
4 OR MORE VEHICLES IN HOUSEHOLD
100.0/ 100
METRIC RATING
60th/ 347
METRIC RANK
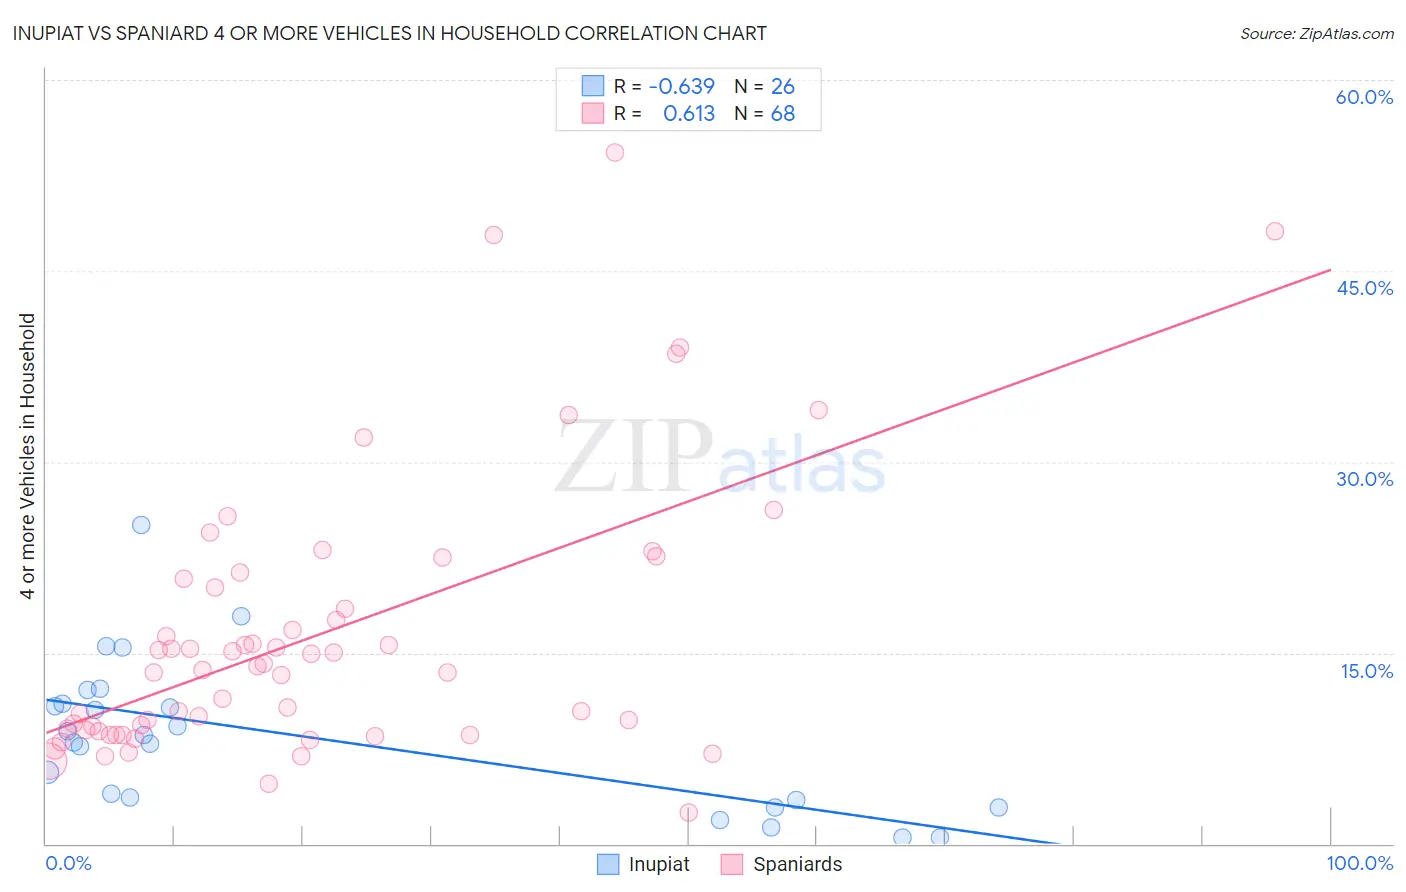
Inupiat vs Spaniard 4 or more Vehicles in Household Correlation Chart
The statistical analysis conducted on geographies consisting of 96,224,562 people shows a significant negative correlation between the proportion of Inupiat and percentage of households with 4 or more vehicles available in the United States with a correlation coefficient (R) of -0.639 and weighted average of 6.2%. Similarly, the statistical analysis conducted on geographies consisting of 441,319,391 people shows a significant positive correlation between the proportion of Spaniards and percentage of households with 4 or more vehicles available in the United States with a correlation coefficient (R) of 0.613 and weighted average of 7.6%, a difference of 22.8%.
4 or more Vehicles in Household Correlation Summary
| Measurement | Inupiat | Spaniard |
| Minimum | 0.47% | 2.4% |
| Maximum | 25.0% | 54.3% |
| Range | 24.5% | 51.9% |
| Mean | 8.4% | 16.4% |
| Median | 8.3% | 13.8% |
| Interquartile 25% (IQ1) | 3.4% | 8.9% |
| Interquartile 75% (IQ3) | 11.0% | 20.5% |
| Interquartile Range (IQR) | 7.5% | 11.6% |
| Standard Deviation (Sample) | 5.9% | 10.8% |
| Standard Deviation (Population) | 5.8% | 10.7% |
Similar Demographics by 4 or more Vehicles in Household
Demographics Similar to Inupiat by 4 or more Vehicles in Household
In terms of 4 or more vehicles in household, the demographic groups most similar to Inupiat are Romanian (6.2%, a difference of 0.010%), South African (6.2%, a difference of 0.18%), Immigrants from Eastern Asia (6.2%, a difference of 0.30%), Immigrants from Kuwait (6.2%, a difference of 0.35%), and Kiowa (6.2%, a difference of 0.47%).
| Demographics | Rating | Rank | 4 or more Vehicles in Household |
| Iraqis | 37.3 /100 | #184 | Fair 6.2% |
| Thais | 36.9 /100 | #185 | Fair 6.2% |
| Immigrants | Northern Europe | 36.8 /100 | #186 | Fair 6.2% |
| Immigrants | South Africa | 35.4 /100 | #187 | Fair 6.2% |
| Kiowa | 34.7 /100 | #188 | Fair 6.2% |
| Immigrants | Eastern Asia | 33.3 /100 | #189 | Fair 6.2% |
| South Africans | 32.2 /100 | #190 | Fair 6.2% |
| Inupiat | 30.7 /100 | #191 | Fair 6.2% |
| Romanians | 30.7 /100 | #192 | Fair 6.2% |
| Immigrants | Kuwait | 28.0 /100 | #193 | Fair 6.2% |
| Immigrants | Sweden | 27.0 /100 | #194 | Fair 6.2% |
| Argentineans | 27.0 /100 | #195 | Fair 6.2% |
| Tsimshian | 26.4 /100 | #196 | Fair 6.2% |
| Immigrants | Sri Lanka | 23.7 /100 | #197 | Fair 6.1% |
| Immigrants | Portugal | 22.3 /100 | #198 | Fair 6.1% |
Demographics Similar to Spaniards by 4 or more Vehicles in Household
In terms of 4 or more vehicles in household, the demographic groups most similar to Spaniards are Hispanic or Latino (7.6%, a difference of 0.060%), Pennsylvania German (7.6%, a difference of 0.10%), Swedish (7.6%, a difference of 0.10%), English (7.6%, a difference of 0.22%), and Immigrants from Oceania (7.6%, a difference of 0.24%).
| Demographics | Rating | Rank | 4 or more Vehicles in Household |
| Malaysians | 100.0 /100 | #53 | Exceptional 7.7% |
| Dutch | 100.0 /100 | #54 | Exceptional 7.7% |
| Immigrants | Oceania | 100.0 /100 | #55 | Exceptional 7.6% |
| English | 100.0 /100 | #56 | Exceptional 7.6% |
| Pennsylvania Germans | 100.0 /100 | #57 | Exceptional 7.6% |
| Swedes | 100.0 /100 | #58 | Exceptional 7.6% |
| Hispanics or Latinos | 100.0 /100 | #59 | Exceptional 7.6% |
| Spaniards | 100.0 /100 | #60 | Exceptional 7.6% |
| Europeans | 100.0 /100 | #61 | Exceptional 7.6% |
| Chippewa | 100.0 /100 | #62 | Exceptional 7.6% |
| Immigrants | Micronesia | 100.0 /100 | #63 | Exceptional 7.6% |
| Bangladeshis | 100.0 /100 | #64 | Exceptional 7.6% |
| Immigrants | Azores | 100.0 /100 | #65 | Exceptional 7.5% |
| Immigrants | Taiwan | 99.9 /100 | #66 | Exceptional 7.5% |
| Americans | 99.9 /100 | #67 | Exceptional 7.5% |