Immigrants from Brazil vs Spaniard 4 or more Vehicles in Household
COMPARE
Immigrants from Brazil
Spaniard
4 or more Vehicles in Household
4 or more Vehicles in Household Comparison
Immigrants from Brazil
Spaniards
5.2%
4 OR MORE VEHICLES IN HOUSEHOLD
0.1/ 100
METRIC RATING
295th/ 347
METRIC RANK
7.6%
4 OR MORE VEHICLES IN HOUSEHOLD
100.0/ 100
METRIC RATING
60th/ 347
METRIC RANK
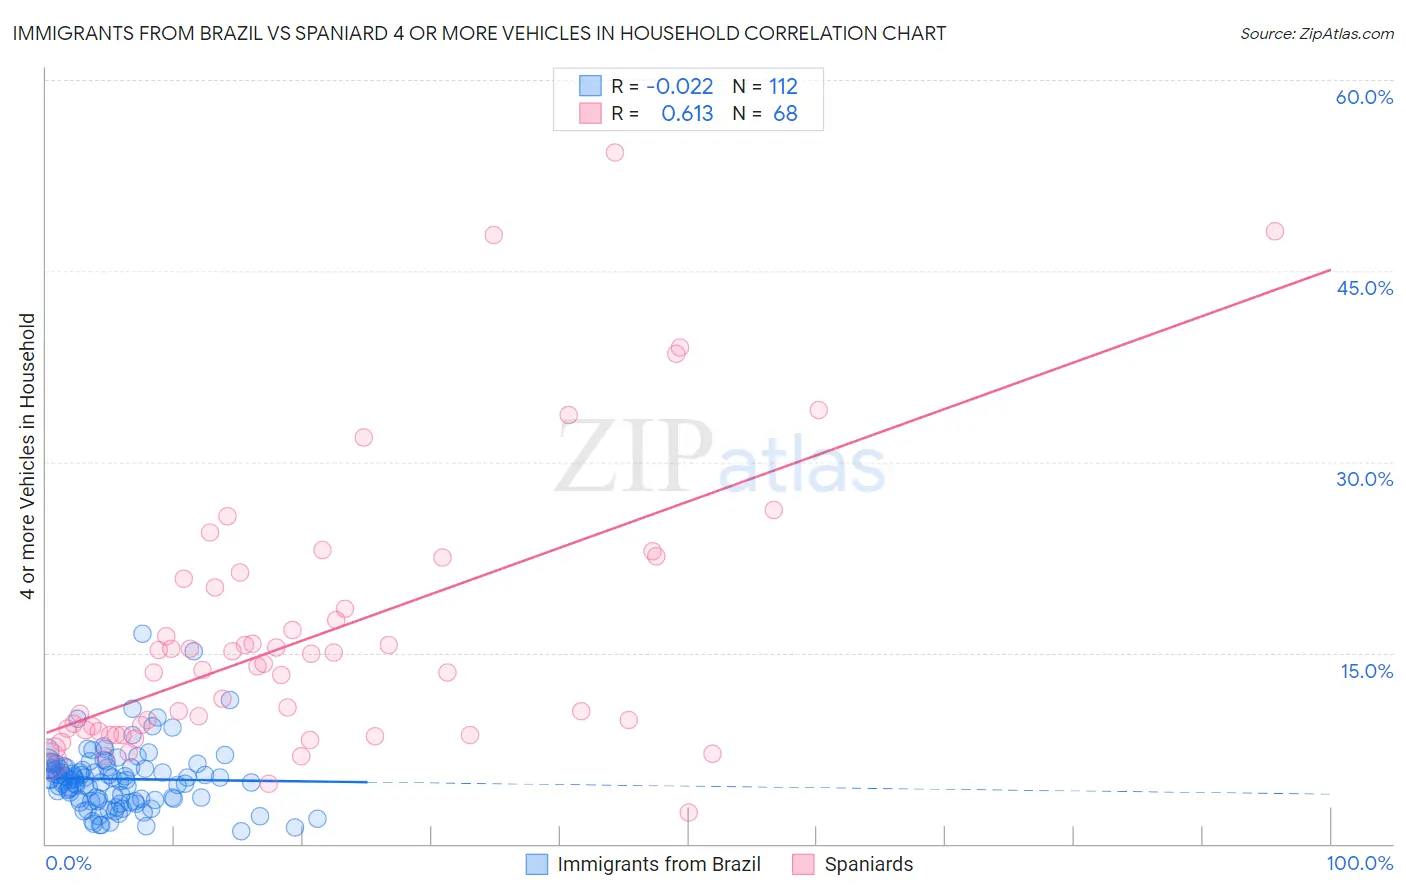
Immigrants from Brazil vs Spaniard 4 or more Vehicles in Household Correlation Chart
The statistical analysis conducted on geographies consisting of 341,468,936 people shows no correlation between the proportion of Immigrants from Brazil and percentage of households with 4 or more vehicles available in the United States with a correlation coefficient (R) of -0.022 and weighted average of 5.2%. Similarly, the statistical analysis conducted on geographies consisting of 441,319,391 people shows a significant positive correlation between the proportion of Spaniards and percentage of households with 4 or more vehicles available in the United States with a correlation coefficient (R) of 0.613 and weighted average of 7.6%, a difference of 45.2%.
4 or more Vehicles in Household Correlation Summary
| Measurement | Immigrants from Brazil | Spaniard |
| Minimum | 0.95% | 2.4% |
| Maximum | 16.5% | 54.3% |
| Range | 15.6% | 51.9% |
| Mean | 5.1% | 16.4% |
| Median | 5.0% | 13.8% |
| Interquartile 25% (IQ1) | 3.5% | 8.9% |
| Interquartile 75% (IQ3) | 6.0% | 20.5% |
| Interquartile Range (IQR) | 2.6% | 11.6% |
| Standard Deviation (Sample) | 2.5% | 10.8% |
| Standard Deviation (Population) | 2.5% | 10.7% |
Similar Demographics by 4 or more Vehicles in Household
Demographics Similar to Immigrants from Brazil by 4 or more Vehicles in Household
In terms of 4 or more vehicles in household, the demographic groups most similar to Immigrants from Brazil are Ghanaian (5.2%, a difference of 0.11%), Immigrants from Congo (5.2%, a difference of 0.17%), Israeli (5.2%, a difference of 0.18%), Liberian (5.3%, a difference of 0.20%), and Immigrants from Bahamas (5.3%, a difference of 0.30%).
| Demographics | Rating | Rank | 4 or more Vehicles in Household |
| Venezuelans | 0.2 /100 | #288 | Tragic 5.3% |
| Immigrants | Bosnia and Herzegovina | 0.2 /100 | #289 | Tragic 5.3% |
| Immigrants | Russia | 0.2 /100 | #290 | Tragic 5.3% |
| Immigrants | Bahamas | 0.1 /100 | #291 | Tragic 5.3% |
| Liberians | 0.1 /100 | #292 | Tragic 5.3% |
| Immigrants | Congo | 0.1 /100 | #293 | Tragic 5.2% |
| Ghanaians | 0.1 /100 | #294 | Tragic 5.2% |
| Immigrants | Brazil | 0.1 /100 | #295 | Tragic 5.2% |
| Israelis | 0.1 /100 | #296 | Tragic 5.2% |
| Immigrants | Venezuela | 0.1 /100 | #297 | Tragic 5.2% |
| Immigrants | South America | 0.1 /100 | #298 | Tragic 5.2% |
| Immigrants | Ghana | 0.1 /100 | #299 | Tragic 5.2% |
| Immigrants | Morocco | 0.0 /100 | #300 | Tragic 5.1% |
| Immigrants | Zaire | 0.0 /100 | #301 | Tragic 5.1% |
| Bahamians | 0.0 /100 | #302 | Tragic 5.1% |
Demographics Similar to Spaniards by 4 or more Vehicles in Household
In terms of 4 or more vehicles in household, the demographic groups most similar to Spaniards are Hispanic or Latino (7.6%, a difference of 0.060%), Pennsylvania German (7.6%, a difference of 0.10%), Swedish (7.6%, a difference of 0.10%), English (7.6%, a difference of 0.22%), and Immigrants from Oceania (7.6%, a difference of 0.24%).
| Demographics | Rating | Rank | 4 or more Vehicles in Household |
| Malaysians | 100.0 /100 | #53 | Exceptional 7.7% |
| Dutch | 100.0 /100 | #54 | Exceptional 7.7% |
| Immigrants | Oceania | 100.0 /100 | #55 | Exceptional 7.6% |
| English | 100.0 /100 | #56 | Exceptional 7.6% |
| Pennsylvania Germans | 100.0 /100 | #57 | Exceptional 7.6% |
| Swedes | 100.0 /100 | #58 | Exceptional 7.6% |
| Hispanics or Latinos | 100.0 /100 | #59 | Exceptional 7.6% |
| Spaniards | 100.0 /100 | #60 | Exceptional 7.6% |
| Europeans | 100.0 /100 | #61 | Exceptional 7.6% |
| Chippewa | 100.0 /100 | #62 | Exceptional 7.6% |
| Immigrants | Micronesia | 100.0 /100 | #63 | Exceptional 7.6% |
| Bangladeshis | 100.0 /100 | #64 | Exceptional 7.6% |
| Immigrants | Azores | 100.0 /100 | #65 | Exceptional 7.5% |
| Immigrants | Taiwan | 99.9 /100 | #66 | Exceptional 7.5% |
| Americans | 99.9 /100 | #67 | Exceptional 7.5% |