Immigrants from Guatemala vs Spaniard High School Diploma
COMPARE
Immigrants from Guatemala
Spaniard
High School Diploma
High School Diploma Comparison
Immigrants from Guatemala
Spaniards
81.4%
HIGH SCHOOL DIPLOMA
0.0/ 100
METRIC RATING
342nd/ 347
METRIC RANK
89.1%
HIGH SCHOOL DIPLOMA
43.4/ 100
METRIC RATING
182nd/ 347
METRIC RANK
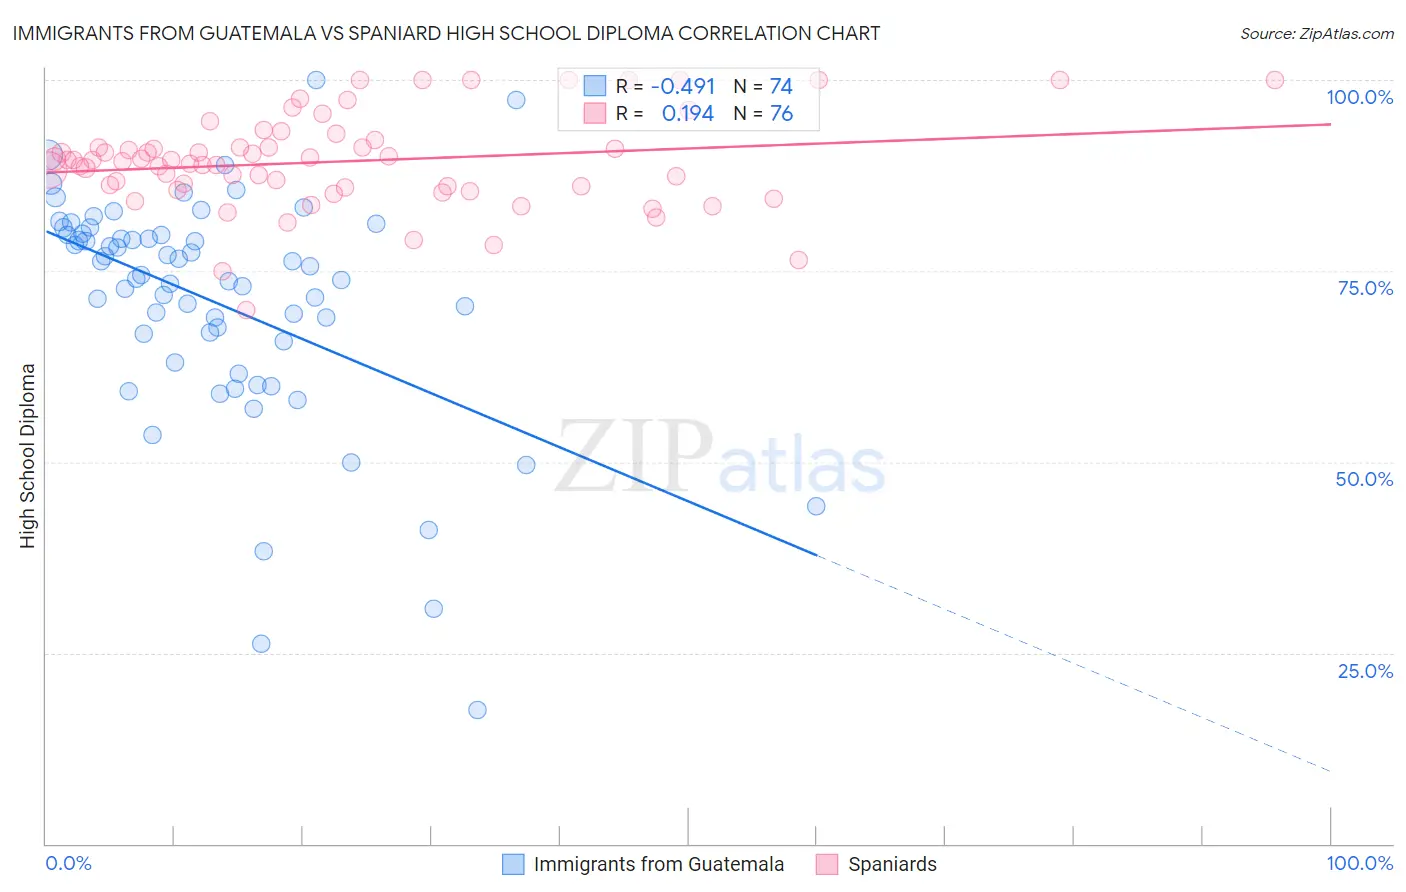
Immigrants from Guatemala vs Spaniard High School Diploma Correlation Chart
The statistical analysis conducted on geographies consisting of 377,286,142 people shows a moderate negative correlation between the proportion of Immigrants from Guatemala and percentage of population with at least high school diploma education in the United States with a correlation coefficient (R) of -0.491 and weighted average of 81.4%. Similarly, the statistical analysis conducted on geographies consisting of 443,545,794 people shows a poor positive correlation between the proportion of Spaniards and percentage of population with at least high school diploma education in the United States with a correlation coefficient (R) of 0.194 and weighted average of 89.1%, a difference of 9.5%.
High School Diploma Correlation Summary
| Measurement | Immigrants from Guatemala | Spaniard |
| Minimum | 17.4% | 69.9% |
| Maximum | 100.0% | 100.0% |
| Range | 82.6% | 30.1% |
| Mean | 70.8% | 89.3% |
| Median | 74.3% | 89.5% |
| Interquartile 25% (IQ1) | 65.9% | 86.0% |
| Interquartile 75% (IQ3) | 79.8% | 91.7% |
| Interquartile Range (IQR) | 13.9% | 5.7% |
| Standard Deviation (Sample) | 15.2% | 6.2% |
| Standard Deviation (Population) | 15.1% | 6.1% |
Similar Demographics by High School Diploma
Demographics Similar to Immigrants from Guatemala by High School Diploma
In terms of high school diploma, the demographic groups most similar to Immigrants from Guatemala are Mexican (81.4%, a difference of 0.040%), Houma (81.5%, a difference of 0.20%), Pima (81.6%, a difference of 0.31%), Salvadoran (81.7%, a difference of 0.40%), and Immigrants from Yemen (81.8%, a difference of 0.58%).
| Demographics | Rating | Rank | High School Diploma |
| Immigrants | Latin America | 0.0 /100 | #333 | Tragic 82.1% |
| Tohono O'odham | 0.0 /100 | #334 | Tragic 82.1% |
| Guatemalans | 0.0 /100 | #335 | Tragic 82.0% |
| Immigrants | Dominican Republic | 0.0 /100 | #336 | Tragic 82.0% |
| Immigrants | Yemen | 0.0 /100 | #337 | Tragic 81.8% |
| Salvadorans | 0.0 /100 | #338 | Tragic 81.7% |
| Pima | 0.0 /100 | #339 | Tragic 81.6% |
| Houma | 0.0 /100 | #340 | Tragic 81.5% |
| Mexicans | 0.0 /100 | #341 | Tragic 81.4% |
| Immigrants | Guatemala | 0.0 /100 | #342 | Tragic 81.4% |
| Immigrants | El Salvador | 0.0 /100 | #343 | Tragic 80.8% |
| Immigrants | Central America | 0.0 /100 | #344 | Tragic 80.1% |
| Yakama | 0.0 /100 | #345 | Tragic 80.0% |
| Spanish American Indians | 0.0 /100 | #346 | Tragic 79.8% |
| Immigrants | Mexico | 0.0 /100 | #347 | Tragic 79.5% |
Demographics Similar to Spaniards by High School Diploma
In terms of high school diploma, the demographic groups most similar to Spaniards are Venezuelan (89.1%, a difference of 0.0%), Potawatomi (89.0%, a difference of 0.010%), Bolivian (89.1%, a difference of 0.030%), American (89.1%, a difference of 0.060%), and Immigrants from Syria (89.0%, a difference of 0.060%).
| Demographics | Rating | Rank | High School Diploma |
| Immigrants | Western Asia | 49.0 /100 | #175 | Average 89.1% |
| Osage | 48.9 /100 | #176 | Average 89.1% |
| Sudanese | 48.5 /100 | #177 | Average 89.1% |
| Sierra Leoneans | 48.4 /100 | #178 | Average 89.1% |
| Americans | 47.2 /100 | #179 | Average 89.1% |
| Bolivians | 45.2 /100 | #180 | Average 89.1% |
| Venezuelans | 43.6 /100 | #181 | Average 89.1% |
| Spaniards | 43.4 /100 | #182 | Average 89.1% |
| Potawatomi | 42.5 /100 | #183 | Average 89.0% |
| Immigrants | Syria | 39.2 /100 | #184 | Fair 89.0% |
| Ethiopians | 37.0 /100 | #185 | Fair 89.0% |
| Immigrants | Eastern Africa | 35.8 /100 | #186 | Fair 88.9% |
| Guamanians/Chamorros | 35.5 /100 | #187 | Fair 88.9% |
| Immigrants | Sudan | 33.4 /100 | #188 | Fair 88.9% |
| Immigrants | Uganda | 32.6 /100 | #189 | Fair 88.9% |