Immigrants from France vs Immigrants from Colombia 4 or more Vehicles in Household
COMPARE
Immigrants from France
Immigrants from Colombia
4 or more Vehicles in Household
4 or more Vehicles in Household Comparison
Immigrants from France
Immigrants from Colombia
5.6%
4 OR MORE VEHICLES IN HOUSEHOLD
1.3/ 100
METRIC RATING
259th/ 347
METRIC RANK
5.4%
4 OR MORE VEHICLES IN HOUSEHOLD
0.2/ 100
METRIC RATING
286th/ 347
METRIC RANK
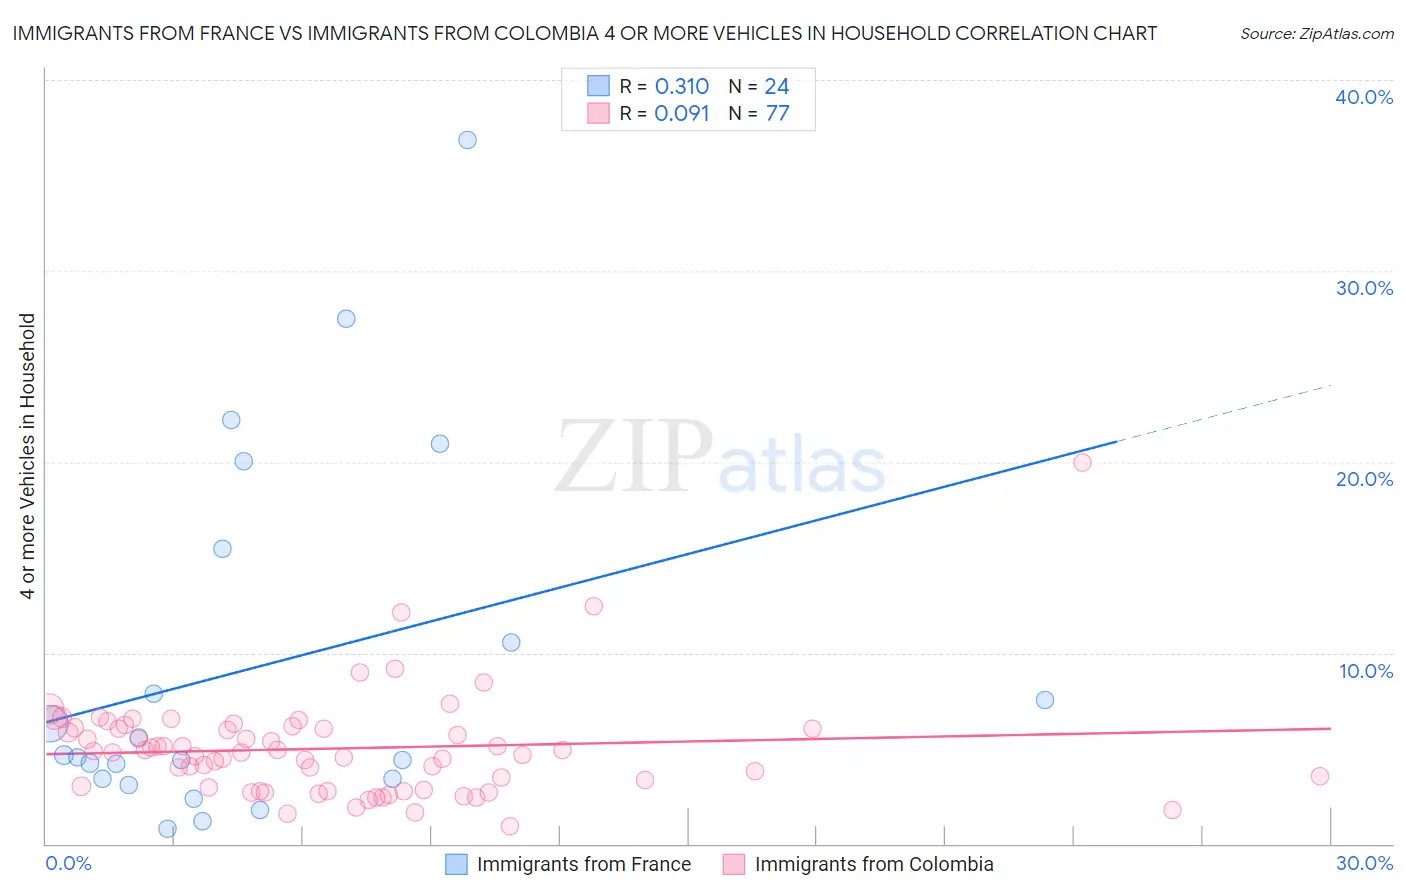
Immigrants from France vs Immigrants from Colombia 4 or more Vehicles in Household Correlation Chart
The statistical analysis conducted on geographies consisting of 286,406,976 people shows a mild positive correlation between the proportion of Immigrants from France and percentage of households with 4 or more vehicles available in the United States with a correlation coefficient (R) of 0.310 and weighted average of 5.6%. Similarly, the statistical analysis conducted on geographies consisting of 377,020,120 people shows a slight positive correlation between the proportion of Immigrants from Colombia and percentage of households with 4 or more vehicles available in the United States with a correlation coefficient (R) of 0.091 and weighted average of 5.4%, a difference of 5.3%.
4 or more Vehicles in Household Correlation Summary
| Measurement | Immigrants from France | Immigrants from Colombia |
| Minimum | 0.81% | 0.92% |
| Maximum | 36.8% | 20.0% |
| Range | 36.0% | 19.1% |
| Mean | 9.3% | 5.0% |
| Median | 4.6% | 4.8% |
| Interquartile 25% (IQ1) | 3.4% | 2.9% |
| Interquartile 75% (IQ3) | 13.0% | 6.0% |
| Interquartile Range (IQR) | 9.6% | 3.1% |
| Standard Deviation (Sample) | 9.5% | 2.8% |
| Standard Deviation (Population) | 9.3% | 2.7% |
Similar Demographics by 4 or more Vehicles in Household
Demographics Similar to Immigrants from France by 4 or more Vehicles in Household
In terms of 4 or more vehicles in household, the demographic groups most similar to Immigrants from France are Immigrants from Lithuania (5.6%, a difference of 0.030%), Immigrants from Northern Africa (5.6%, a difference of 0.17%), Uruguayan (5.6%, a difference of 0.18%), Immigrants from Turkey (5.7%, a difference of 0.25%), and Sudanese (5.6%, a difference of 0.27%).
| Demographics | Rating | Rank | 4 or more Vehicles in Household |
| Sub-Saharan Africans | 2.1 /100 | #252 | Tragic 5.7% |
| Immigrants | Cuba | 1.6 /100 | #253 | Tragic 5.7% |
| Immigrants | Panama | 1.5 /100 | #254 | Tragic 5.7% |
| Yup'ik | 1.5 /100 | #255 | Tragic 5.7% |
| Immigrants | Turkey | 1.5 /100 | #256 | Tragic 5.7% |
| Immigrants | Northern Africa | 1.4 /100 | #257 | Tragic 5.6% |
| Immigrants | Lithuania | 1.4 /100 | #258 | Tragic 5.6% |
| Immigrants | France | 1.3 /100 | #259 | Tragic 5.6% |
| Uruguayans | 1.3 /100 | #260 | Tragic 5.6% |
| Sudanese | 1.2 /100 | #261 | Tragic 5.6% |
| Bermudans | 1.2 /100 | #262 | Tragic 5.6% |
| Immigrants | Saudi Arabia | 1.1 /100 | #263 | Tragic 5.6% |
| Immigrants | Africa | 1.0 /100 | #264 | Tragic 5.6% |
| South Americans | 0.9 /100 | #265 | Tragic 5.6% |
| Immigrants | Nepal | 0.9 /100 | #266 | Tragic 5.6% |
Demographics Similar to Immigrants from Colombia by 4 or more Vehicles in Household
In terms of 4 or more vehicles in household, the demographic groups most similar to Immigrants from Colombia are Immigrants from Liberia (5.4%, a difference of 0.040%), Immigrants from Croatia (5.4%, a difference of 0.10%), Venezuelan (5.3%, a difference of 0.28%), Brazilian (5.4%, a difference of 0.38%), and Immigrants from Bosnia and Herzegovina (5.3%, a difference of 0.42%).
| Demographics | Rating | Rank | 4 or more Vehicles in Household |
| Immigrants | Uruguay | 0.3 /100 | #279 | Tragic 5.4% |
| Alsatians | 0.3 /100 | #280 | Tragic 5.4% |
| Immigrants | Western Africa | 0.3 /100 | #281 | Tragic 5.4% |
| Immigrants | Spain | 0.3 /100 | #282 | Tragic 5.4% |
| Immigrants | Ireland | 0.3 /100 | #283 | Tragic 5.4% |
| Brazilians | 0.3 /100 | #284 | Tragic 5.4% |
| Immigrants | Liberia | 0.2 /100 | #285 | Tragic 5.4% |
| Immigrants | Colombia | 0.2 /100 | #286 | Tragic 5.4% |
| Immigrants | Croatia | 0.2 /100 | #287 | Tragic 5.4% |
| Venezuelans | 0.2 /100 | #288 | Tragic 5.3% |
| Immigrants | Bosnia and Herzegovina | 0.2 /100 | #289 | Tragic 5.3% |
| Immigrants | Russia | 0.2 /100 | #290 | Tragic 5.3% |
| Immigrants | Bahamas | 0.1 /100 | #291 | Tragic 5.3% |
| Liberians | 0.1 /100 | #292 | Tragic 5.3% |
| Immigrants | Congo | 0.1 /100 | #293 | Tragic 5.2% |