English vs Immigrants from Colombia 4 or more Vehicles in Household
COMPARE
English
Immigrants from Colombia
4 or more Vehicles in Household
4 or more Vehicles in Household Comparison
English
Immigrants from Colombia
7.6%
4 OR MORE VEHICLES IN HOUSEHOLD
100.0/ 100
METRIC RATING
56th/ 347
METRIC RANK
5.4%
4 OR MORE VEHICLES IN HOUSEHOLD
0.2/ 100
METRIC RATING
286th/ 347
METRIC RANK
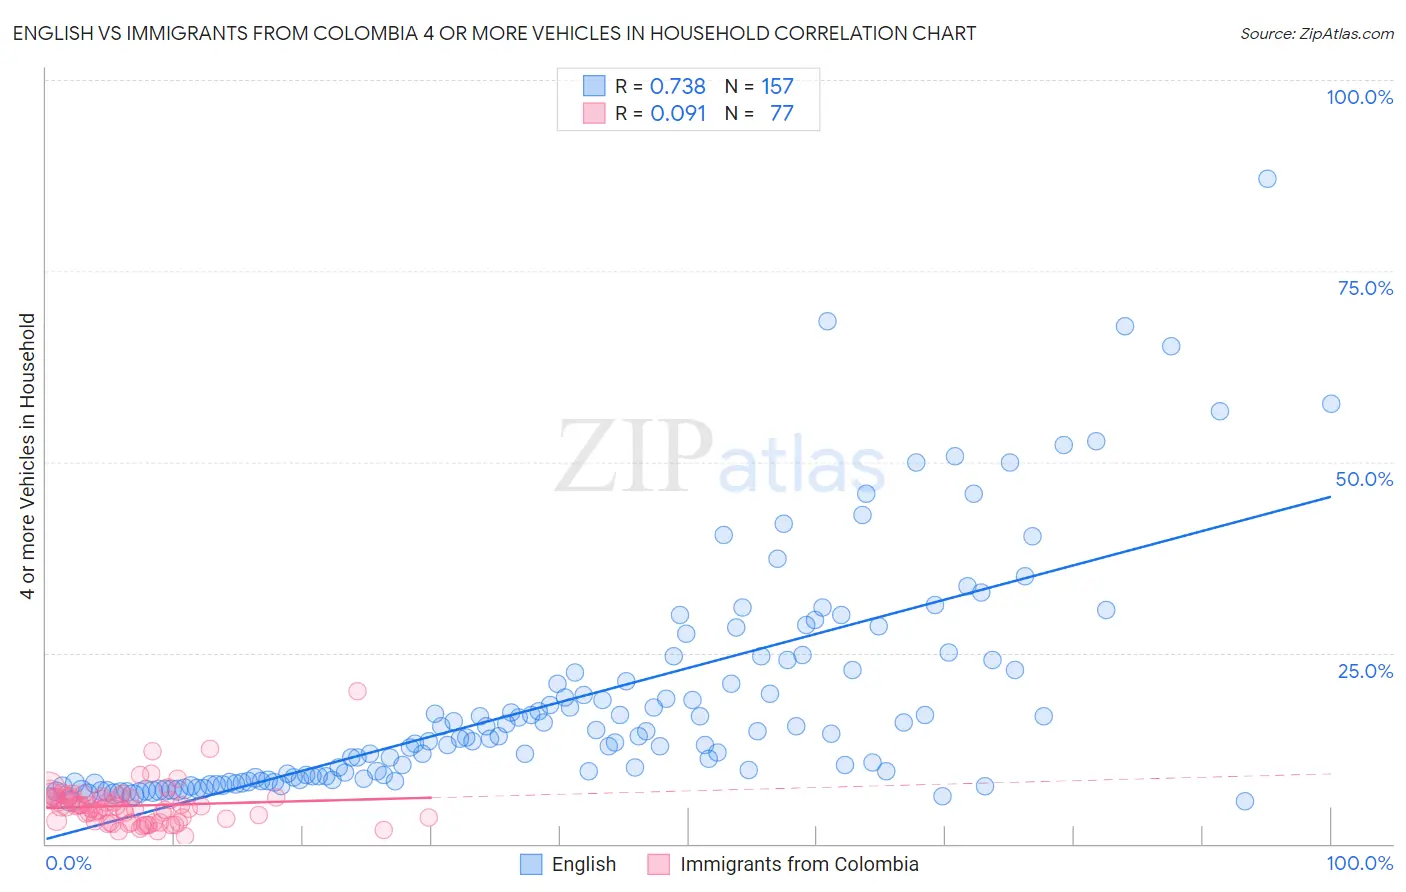
English vs Immigrants from Colombia 4 or more Vehicles in Household Correlation Chart
The statistical analysis conducted on geographies consisting of 575,671,099 people shows a strong positive correlation between the proportion of English and percentage of households with 4 or more vehicles available in the United States with a correlation coefficient (R) of 0.738 and weighted average of 7.6%. Similarly, the statistical analysis conducted on geographies consisting of 377,020,120 people shows a slight positive correlation between the proportion of Immigrants from Colombia and percentage of households with 4 or more vehicles available in the United States with a correlation coefficient (R) of 0.091 and weighted average of 5.4%, a difference of 42.4%.
4 or more Vehicles in Household Correlation Summary
| Measurement | English | Immigrants from Colombia |
| Minimum | 5.6% | 0.92% |
| Maximum | 87.1% | 20.0% |
| Range | 81.5% | 19.1% |
| Mean | 18.6% | 5.0% |
| Median | 13.7% | 4.8% |
| Interquartile 25% (IQ1) | 8.3% | 2.9% |
| Interquartile 75% (IQ3) | 22.8% | 6.0% |
| Interquartile Range (IQR) | 14.5% | 3.1% |
| Standard Deviation (Sample) | 14.8% | 2.8% |
| Standard Deviation (Population) | 14.8% | 2.7% |
Similar Demographics by 4 or more Vehicles in Household
Demographics Similar to English by 4 or more Vehicles in Household
In terms of 4 or more vehicles in household, the demographic groups most similar to English are Immigrants from Oceania (7.6%, a difference of 0.010%), Pennsylvania German (7.6%, a difference of 0.12%), Swedish (7.6%, a difference of 0.12%), Hispanic or Latino (7.6%, a difference of 0.16%), and Spaniard (7.6%, a difference of 0.22%).
| Demographics | Rating | Rank | 4 or more Vehicles in Household |
| Cherokee | 100.0 /100 | #49 | Exceptional 7.7% |
| Immigrants | El Salvador | 100.0 /100 | #50 | Exceptional 7.7% |
| Immigrants | Laos | 100.0 /100 | #51 | Exceptional 7.7% |
| Japanese | 100.0 /100 | #52 | Exceptional 7.7% |
| Malaysians | 100.0 /100 | #53 | Exceptional 7.7% |
| Dutch | 100.0 /100 | #54 | Exceptional 7.7% |
| Immigrants | Oceania | 100.0 /100 | #55 | Exceptional 7.6% |
| English | 100.0 /100 | #56 | Exceptional 7.6% |
| Pennsylvania Germans | 100.0 /100 | #57 | Exceptional 7.6% |
| Swedes | 100.0 /100 | #58 | Exceptional 7.6% |
| Hispanics or Latinos | 100.0 /100 | #59 | Exceptional 7.6% |
| Spaniards | 100.0 /100 | #60 | Exceptional 7.6% |
| Europeans | 100.0 /100 | #61 | Exceptional 7.6% |
| Chippewa | 100.0 /100 | #62 | Exceptional 7.6% |
| Immigrants | Micronesia | 100.0 /100 | #63 | Exceptional 7.6% |
Demographics Similar to Immigrants from Colombia by 4 or more Vehicles in Household
In terms of 4 or more vehicles in household, the demographic groups most similar to Immigrants from Colombia are Immigrants from Liberia (5.4%, a difference of 0.040%), Immigrants from Croatia (5.4%, a difference of 0.10%), Venezuelan (5.3%, a difference of 0.28%), Brazilian (5.4%, a difference of 0.38%), and Immigrants from Bosnia and Herzegovina (5.3%, a difference of 0.42%).
| Demographics | Rating | Rank | 4 or more Vehicles in Household |
| Immigrants | Uruguay | 0.3 /100 | #279 | Tragic 5.4% |
| Alsatians | 0.3 /100 | #280 | Tragic 5.4% |
| Immigrants | Western Africa | 0.3 /100 | #281 | Tragic 5.4% |
| Immigrants | Spain | 0.3 /100 | #282 | Tragic 5.4% |
| Immigrants | Ireland | 0.3 /100 | #283 | Tragic 5.4% |
| Brazilians | 0.3 /100 | #284 | Tragic 5.4% |
| Immigrants | Liberia | 0.2 /100 | #285 | Tragic 5.4% |
| Immigrants | Colombia | 0.2 /100 | #286 | Tragic 5.4% |
| Immigrants | Croatia | 0.2 /100 | #287 | Tragic 5.4% |
| Venezuelans | 0.2 /100 | #288 | Tragic 5.3% |
| Immigrants | Bosnia and Herzegovina | 0.2 /100 | #289 | Tragic 5.3% |
| Immigrants | Russia | 0.2 /100 | #290 | Tragic 5.3% |
| Immigrants | Bahamas | 0.1 /100 | #291 | Tragic 5.3% |
| Liberians | 0.1 /100 | #292 | Tragic 5.3% |
| Immigrants | Congo | 0.1 /100 | #293 | Tragic 5.2% |