Immigrants from France vs Immigrants from Jordan 4 or more Vehicles in Household
COMPARE
Immigrants from France
Immigrants from Jordan
4 or more Vehicles in Household
4 or more Vehicles in Household Comparison
Immigrants from France
Immigrants from Jordan
5.6%
4 OR MORE VEHICLES IN HOUSEHOLD
1.3/ 100
METRIC RATING
259th/ 347
METRIC RANK
6.5%
4 OR MORE VEHICLES IN HOUSEHOLD
73.7/ 100
METRIC RATING
148th/ 347
METRIC RANK
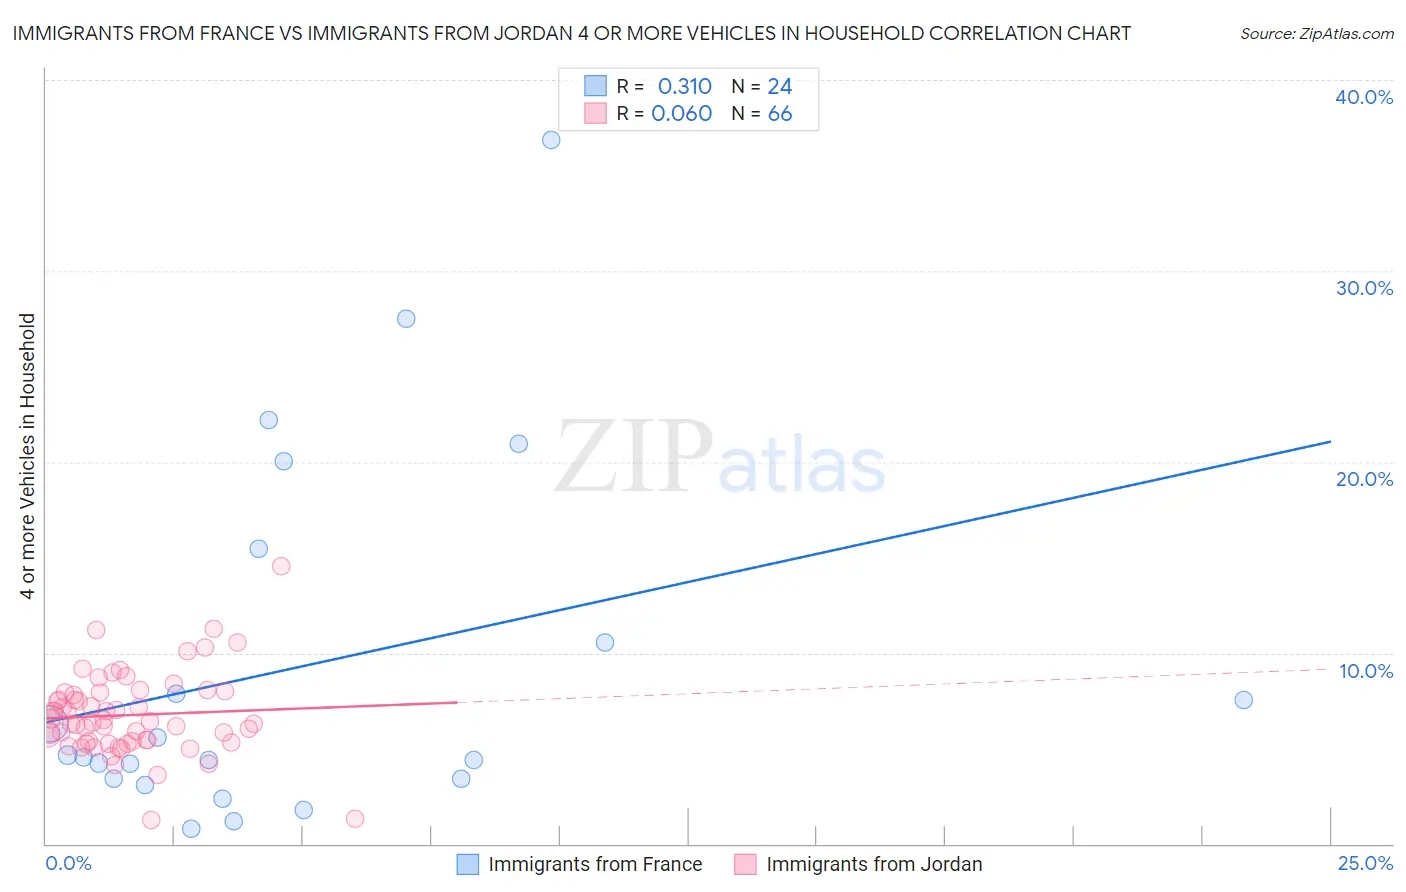
Immigrants from France vs Immigrants from Jordan 4 or more Vehicles in Household Correlation Chart
The statistical analysis conducted on geographies consisting of 286,406,976 people shows a mild positive correlation between the proportion of Immigrants from France and percentage of households with 4 or more vehicles available in the United States with a correlation coefficient (R) of 0.310 and weighted average of 5.6%. Similarly, the statistical analysis conducted on geographies consisting of 180,706,112 people shows a slight positive correlation between the proportion of Immigrants from Jordan and percentage of households with 4 or more vehicles available in the United States with a correlation coefficient (R) of 0.060 and weighted average of 6.5%, a difference of 15.1%.
4 or more Vehicles in Household Correlation Summary
| Measurement | Immigrants from France | Immigrants from Jordan |
| Minimum | 0.81% | 1.3% |
| Maximum | 36.8% | 14.5% |
| Range | 36.0% | 13.3% |
| Mean | 9.3% | 6.7% |
| Median | 4.6% | 6.4% |
| Interquartile 25% (IQ1) | 3.4% | 5.3% |
| Interquartile 75% (IQ3) | 13.0% | 7.9% |
| Interquartile Range (IQR) | 9.6% | 2.6% |
| Standard Deviation (Sample) | 9.5% | 2.2% |
| Standard Deviation (Population) | 9.3% | 2.2% |
Similar Demographics by 4 or more Vehicles in Household
Demographics Similar to Immigrants from France by 4 or more Vehicles in Household
In terms of 4 or more vehicles in household, the demographic groups most similar to Immigrants from France are Immigrants from Lithuania (5.6%, a difference of 0.030%), Immigrants from Northern Africa (5.6%, a difference of 0.17%), Uruguayan (5.6%, a difference of 0.18%), Immigrants from Turkey (5.7%, a difference of 0.25%), and Sudanese (5.6%, a difference of 0.27%).
| Demographics | Rating | Rank | 4 or more Vehicles in Household |
| Sub-Saharan Africans | 2.1 /100 | #252 | Tragic 5.7% |
| Immigrants | Cuba | 1.6 /100 | #253 | Tragic 5.7% |
| Immigrants | Panama | 1.5 /100 | #254 | Tragic 5.7% |
| Yup'ik | 1.5 /100 | #255 | Tragic 5.7% |
| Immigrants | Turkey | 1.5 /100 | #256 | Tragic 5.7% |
| Immigrants | Northern Africa | 1.4 /100 | #257 | Tragic 5.6% |
| Immigrants | Lithuania | 1.4 /100 | #258 | Tragic 5.6% |
| Immigrants | France | 1.3 /100 | #259 | Tragic 5.6% |
| Uruguayans | 1.3 /100 | #260 | Tragic 5.6% |
| Sudanese | 1.2 /100 | #261 | Tragic 5.6% |
| Bermudans | 1.2 /100 | #262 | Tragic 5.6% |
| Immigrants | Saudi Arabia | 1.1 /100 | #263 | Tragic 5.6% |
| Immigrants | Africa | 1.0 /100 | #264 | Tragic 5.6% |
| South Americans | 0.9 /100 | #265 | Tragic 5.6% |
| Immigrants | Nepal | 0.9 /100 | #266 | Tragic 5.6% |
Demographics Similar to Immigrants from Jordan by 4 or more Vehicles in Household
In terms of 4 or more vehicles in household, the demographic groups most similar to Immigrants from Jordan are Greek (6.5%, a difference of 0.0%), Immigrants from Iran (6.5%, a difference of 0.040%), New Zealander (6.5%, a difference of 0.040%), Immigrants from Costa Rica (6.5%, a difference of 0.090%), and Immigrants from Hong Kong (6.5%, a difference of 0.18%).
| Demographics | Rating | Rank | 4 or more Vehicles in Household |
| Australians | 80.8 /100 | #141 | Excellent 6.6% |
| Immigrants | Iraq | 79.4 /100 | #142 | Good 6.5% |
| Immigrants | Canada | 78.6 /100 | #143 | Good 6.5% |
| Immigrants | North America | 78.5 /100 | #144 | Good 6.5% |
| Croatians | 77.8 /100 | #145 | Good 6.5% |
| Immigrants | Costa Rica | 74.4 /100 | #146 | Good 6.5% |
| Immigrants | Iran | 73.9 /100 | #147 | Good 6.5% |
| Immigrants | Jordan | 73.7 /100 | #148 | Good 6.5% |
| Greeks | 73.6 /100 | #149 | Good 6.5% |
| New Zealanders | 73.3 /100 | #150 | Good 6.5% |
| Immigrants | Hong Kong | 72.2 /100 | #151 | Good 6.5% |
| Yuman | 72.1 /100 | #152 | Good 6.5% |
| Immigrants | Armenia | 71.2 /100 | #153 | Good 6.5% |
| Central American Indians | 71.1 /100 | #154 | Good 6.5% |
| Iroquois | 70.4 /100 | #155 | Good 6.5% |