Finnish vs Immigrants from Colombia 4 or more Vehicles in Household
COMPARE
Finnish
Immigrants from Colombia
4 or more Vehicles in Household
4 or more Vehicles in Household Comparison
Finns
Immigrants from Colombia
7.3%
4 OR MORE VEHICLES IN HOUSEHOLD
99.8/ 100
METRIC RATING
81st/ 347
METRIC RANK
5.4%
4 OR MORE VEHICLES IN HOUSEHOLD
0.2/ 100
METRIC RATING
286th/ 347
METRIC RANK
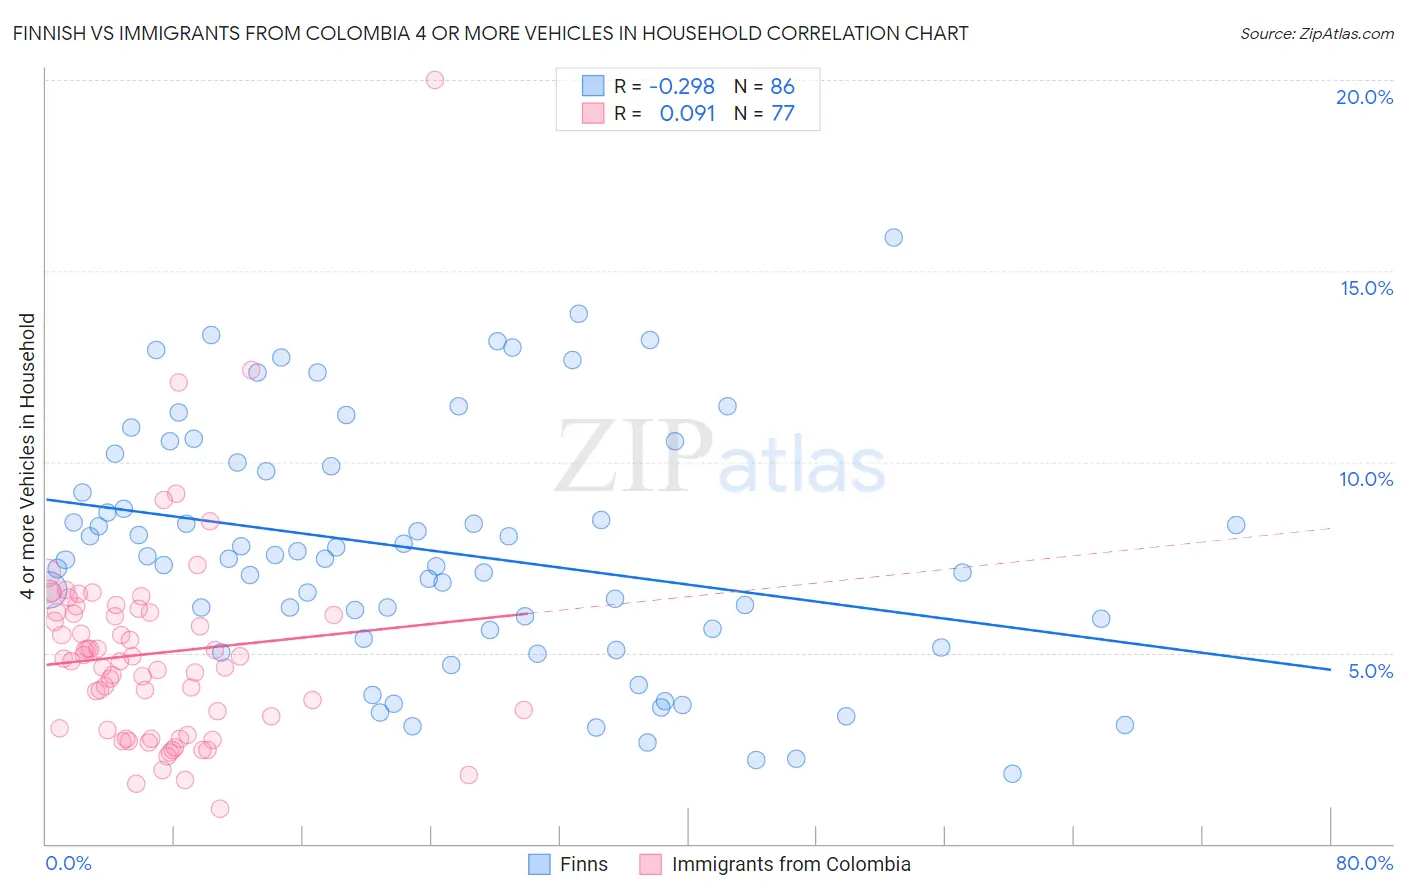
Finnish vs Immigrants from Colombia 4 or more Vehicles in Household Correlation Chart
The statistical analysis conducted on geographies consisting of 403,293,197 people shows a weak negative correlation between the proportion of Finns and percentage of households with 4 or more vehicles available in the United States with a correlation coefficient (R) of -0.298 and weighted average of 7.3%. Similarly, the statistical analysis conducted on geographies consisting of 377,020,120 people shows a slight positive correlation between the proportion of Immigrants from Colombia and percentage of households with 4 or more vehicles available in the United States with a correlation coefficient (R) of 0.091 and weighted average of 5.4%, a difference of 36.3%.
4 or more Vehicles in Household Correlation Summary
| Measurement | Finnish | Immigrants from Colombia |
| Minimum | 1.8% | 0.92% |
| Maximum | 15.9% | 20.0% |
| Range | 14.0% | 19.1% |
| Mean | 7.7% | 5.0% |
| Median | 7.5% | 4.8% |
| Interquartile 25% (IQ1) | 5.6% | 2.9% |
| Interquartile 75% (IQ3) | 9.9% | 6.0% |
| Interquartile Range (IQR) | 4.3% | 3.1% |
| Standard Deviation (Sample) | 3.2% | 2.8% |
| Standard Deviation (Population) | 3.1% | 2.7% |
Similar Demographics by 4 or more Vehicles in Household
Demographics Similar to Finns by 4 or more Vehicles in Household
In terms of 4 or more vehicles in household, the demographic groups most similar to Finns are Northern European (7.3%, a difference of 0.20%), Potawatomi (7.3%, a difference of 0.32%), Alaska Native (7.3%, a difference of 0.56%), Afghan (7.3%, a difference of 0.65%), and Czech (7.4%, a difference of 0.70%).
| Demographics | Rating | Rank | 4 or more Vehicles in Household |
| Icelanders | 99.9 /100 | #74 | Exceptional 7.4% |
| Immigrants | Cambodia | 99.9 /100 | #75 | Exceptional 7.4% |
| Laotians | 99.9 /100 | #76 | Exceptional 7.4% |
| Apache | 99.9 /100 | #77 | Exceptional 7.4% |
| Whites/Caucasians | 99.8 /100 | #78 | Exceptional 7.4% |
| Czechs | 99.8 /100 | #79 | Exceptional 7.4% |
| Alaska Natives | 99.8 /100 | #80 | Exceptional 7.3% |
| Finns | 99.8 /100 | #81 | Exceptional 7.3% |
| Northern Europeans | 99.8 /100 | #82 | Exceptional 7.3% |
| Potawatomi | 99.7 /100 | #83 | Exceptional 7.3% |
| Afghans | 99.7 /100 | #84 | Exceptional 7.3% |
| Cree | 99.7 /100 | #85 | Exceptional 7.2% |
| Immigrants | Indonesia | 99.6 /100 | #86 | Exceptional 7.2% |
| Delaware | 99.6 /100 | #87 | Exceptional 7.2% |
| Immigrants | Nonimmigrants | 99.6 /100 | #88 | Exceptional 7.2% |
Demographics Similar to Immigrants from Colombia by 4 or more Vehicles in Household
In terms of 4 or more vehicles in household, the demographic groups most similar to Immigrants from Colombia are Immigrants from Liberia (5.4%, a difference of 0.040%), Immigrants from Croatia (5.4%, a difference of 0.10%), Venezuelan (5.3%, a difference of 0.28%), Brazilian (5.4%, a difference of 0.38%), and Immigrants from Bosnia and Herzegovina (5.3%, a difference of 0.42%).
| Demographics | Rating | Rank | 4 or more Vehicles in Household |
| Immigrants | Uruguay | 0.3 /100 | #279 | Tragic 5.4% |
| Alsatians | 0.3 /100 | #280 | Tragic 5.4% |
| Immigrants | Western Africa | 0.3 /100 | #281 | Tragic 5.4% |
| Immigrants | Spain | 0.3 /100 | #282 | Tragic 5.4% |
| Immigrants | Ireland | 0.3 /100 | #283 | Tragic 5.4% |
| Brazilians | 0.3 /100 | #284 | Tragic 5.4% |
| Immigrants | Liberia | 0.2 /100 | #285 | Tragic 5.4% |
| Immigrants | Colombia | 0.2 /100 | #286 | Tragic 5.4% |
| Immigrants | Croatia | 0.2 /100 | #287 | Tragic 5.4% |
| Venezuelans | 0.2 /100 | #288 | Tragic 5.3% |
| Immigrants | Bosnia and Herzegovina | 0.2 /100 | #289 | Tragic 5.3% |
| Immigrants | Russia | 0.2 /100 | #290 | Tragic 5.3% |
| Immigrants | Bahamas | 0.1 /100 | #291 | Tragic 5.3% |
| Liberians | 0.1 /100 | #292 | Tragic 5.3% |
| Immigrants | Congo | 0.1 /100 | #293 | Tragic 5.2% |