Immigrants from France vs Immigrants from Bulgaria 4 or more Vehicles in Household
COMPARE
Immigrants from France
Immigrants from Bulgaria
4 or more Vehicles in Household
4 or more Vehicles in Household Comparison
Immigrants from France
Immigrants from Bulgaria
5.6%
4 OR MORE VEHICLES IN HOUSEHOLD
1.3/ 100
METRIC RATING
259th/ 347
METRIC RANK
5.5%
4 OR MORE VEHICLES IN HOUSEHOLD
0.5/ 100
METRIC RATING
277th/ 347
METRIC RANK
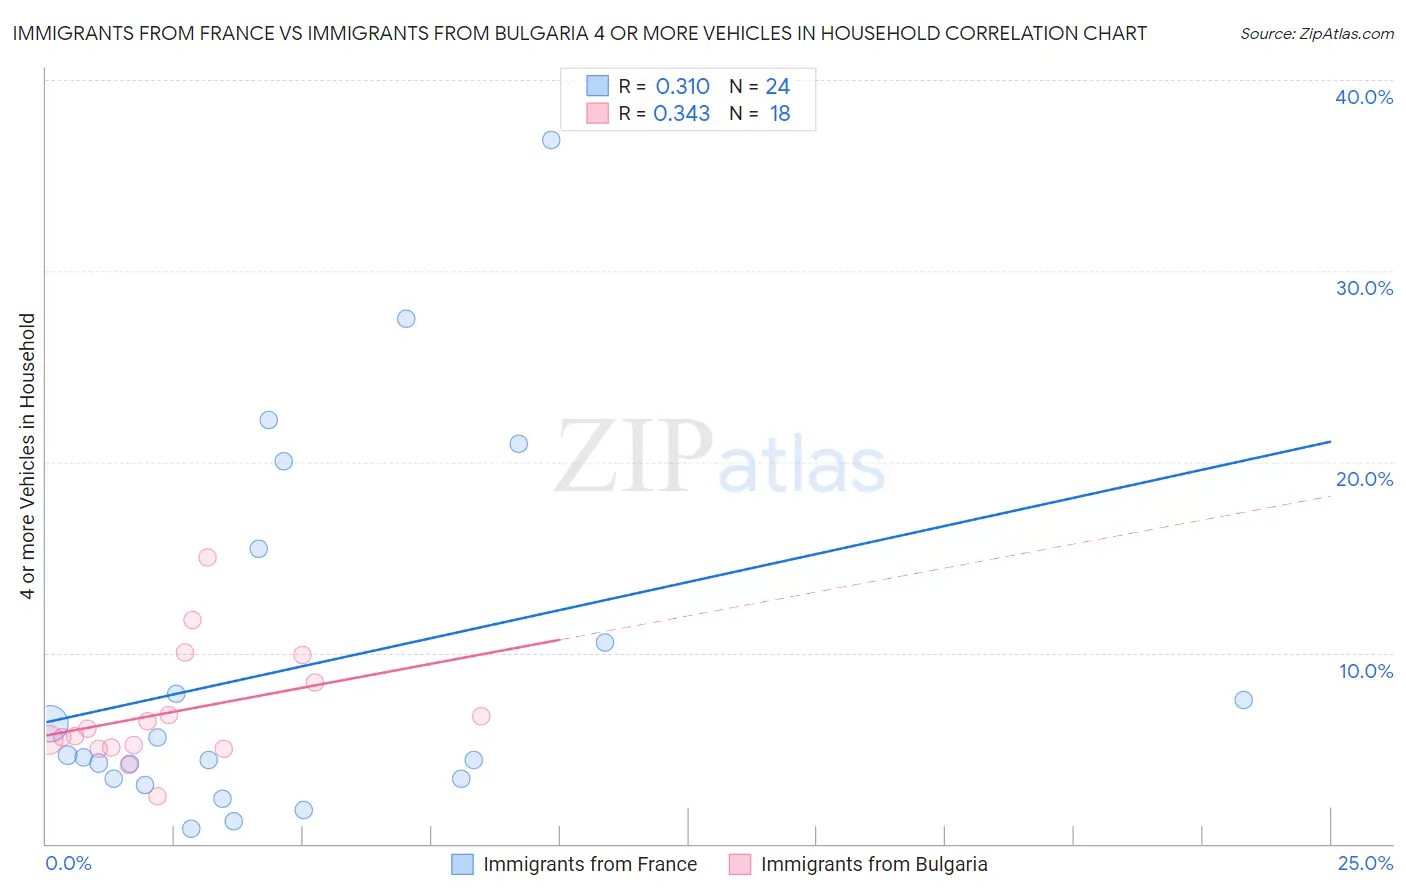
Immigrants from France vs Immigrants from Bulgaria 4 or more Vehicles in Household Correlation Chart
The statistical analysis conducted on geographies consisting of 286,406,976 people shows a mild positive correlation between the proportion of Immigrants from France and percentage of households with 4 or more vehicles available in the United States with a correlation coefficient (R) of 0.310 and weighted average of 5.6%. Similarly, the statistical analysis conducted on geographies consisting of 172,084,774 people shows a mild positive correlation between the proportion of Immigrants from Bulgaria and percentage of households with 4 or more vehicles available in the United States with a correlation coefficient (R) of 0.343 and weighted average of 5.5%, a difference of 2.9%.
4 or more Vehicles in Household Correlation Summary
| Measurement | Immigrants from France | Immigrants from Bulgaria |
| Minimum | 0.81% | 2.5% |
| Maximum | 36.8% | 15.0% |
| Range | 36.0% | 12.5% |
| Mean | 9.3% | 6.9% |
| Median | 4.6% | 5.8% |
| Interquartile 25% (IQ1) | 3.4% | 5.1% |
| Interquartile 75% (IQ3) | 13.0% | 8.4% |
| Interquartile Range (IQR) | 9.6% | 3.4% |
| Standard Deviation (Sample) | 9.5% | 3.0% |
| Standard Deviation (Population) | 9.3% | 3.0% |
Demographics Similar to Immigrants from France and Immigrants from Bulgaria by 4 or more Vehicles in Household
In terms of 4 or more vehicles in household, the demographic groups most similar to Immigrants from France are Immigrants from Lithuania (5.6%, a difference of 0.030%), Uruguayan (5.6%, a difference of 0.18%), Sudanese (5.6%, a difference of 0.27%), Bermudan (5.6%, a difference of 0.38%), and Immigrants from Saudi Arabia (5.6%, a difference of 0.47%). Similarly, the demographic groups most similar to Immigrants from Bulgaria are Immigrants from Latvia (5.5%, a difference of 0.12%), Cambodian (5.5%, a difference of 0.13%), Black/African American (5.5%, a difference of 0.25%), Macedonian (5.5%, a difference of 0.37%), and Immigrants from Kazakhstan (5.5%, a difference of 0.40%).
| Demographics | Rating | Rank | 4 or more Vehicles in Household |
| Immigrants | Lithuania | 1.4 /100 | #258 | Tragic 5.6% |
| Immigrants | France | 1.3 /100 | #259 | Tragic 5.6% |
| Uruguayans | 1.3 /100 | #260 | Tragic 5.6% |
| Sudanese | 1.2 /100 | #261 | Tragic 5.6% |
| Bermudans | 1.2 /100 | #262 | Tragic 5.6% |
| Immigrants | Saudi Arabia | 1.1 /100 | #263 | Tragic 5.6% |
| Immigrants | Africa | 1.0 /100 | #264 | Tragic 5.6% |
| South Americans | 0.9 /100 | #265 | Tragic 5.6% |
| Immigrants | Nepal | 0.9 /100 | #266 | Tragic 5.6% |
| Immigrants | Ukraine | 0.9 /100 | #267 | Tragic 5.6% |
| Colombians | 0.7 /100 | #268 | Tragic 5.5% |
| Carpatho Rusyns | 0.7 /100 | #269 | Tragic 5.5% |
| Okinawans | 0.6 /100 | #270 | Tragic 5.5% |
| Immigrants | Sudan | 0.6 /100 | #271 | Tragic 5.5% |
| Immigrants | Kazakhstan | 0.6 /100 | #272 | Tragic 5.5% |
| Macedonians | 0.6 /100 | #273 | Tragic 5.5% |
| Blacks/African Americans | 0.6 /100 | #274 | Tragic 5.5% |
| Cambodians | 0.5 /100 | #275 | Tragic 5.5% |
| Immigrants | Latvia | 0.5 /100 | #276 | Tragic 5.5% |
| Immigrants | Bulgaria | 0.5 /100 | #277 | Tragic 5.5% |
| Immigrants | Eastern Europe | 0.4 /100 | #278 | Tragic 5.4% |