Immigrants from France vs Czechoslovakian 4 or more Vehicles in Household
COMPARE
Immigrants from France
Czechoslovakian
4 or more Vehicles in Household
4 or more Vehicles in Household Comparison
Immigrants from France
Czechoslovakians
5.6%
4 OR MORE VEHICLES IN HOUSEHOLD
1.3/ 100
METRIC RATING
259th/ 347
METRIC RANK
7.1%
4 OR MORE VEHICLES IN HOUSEHOLD
99.3/ 100
METRIC RATING
95th/ 347
METRIC RANK
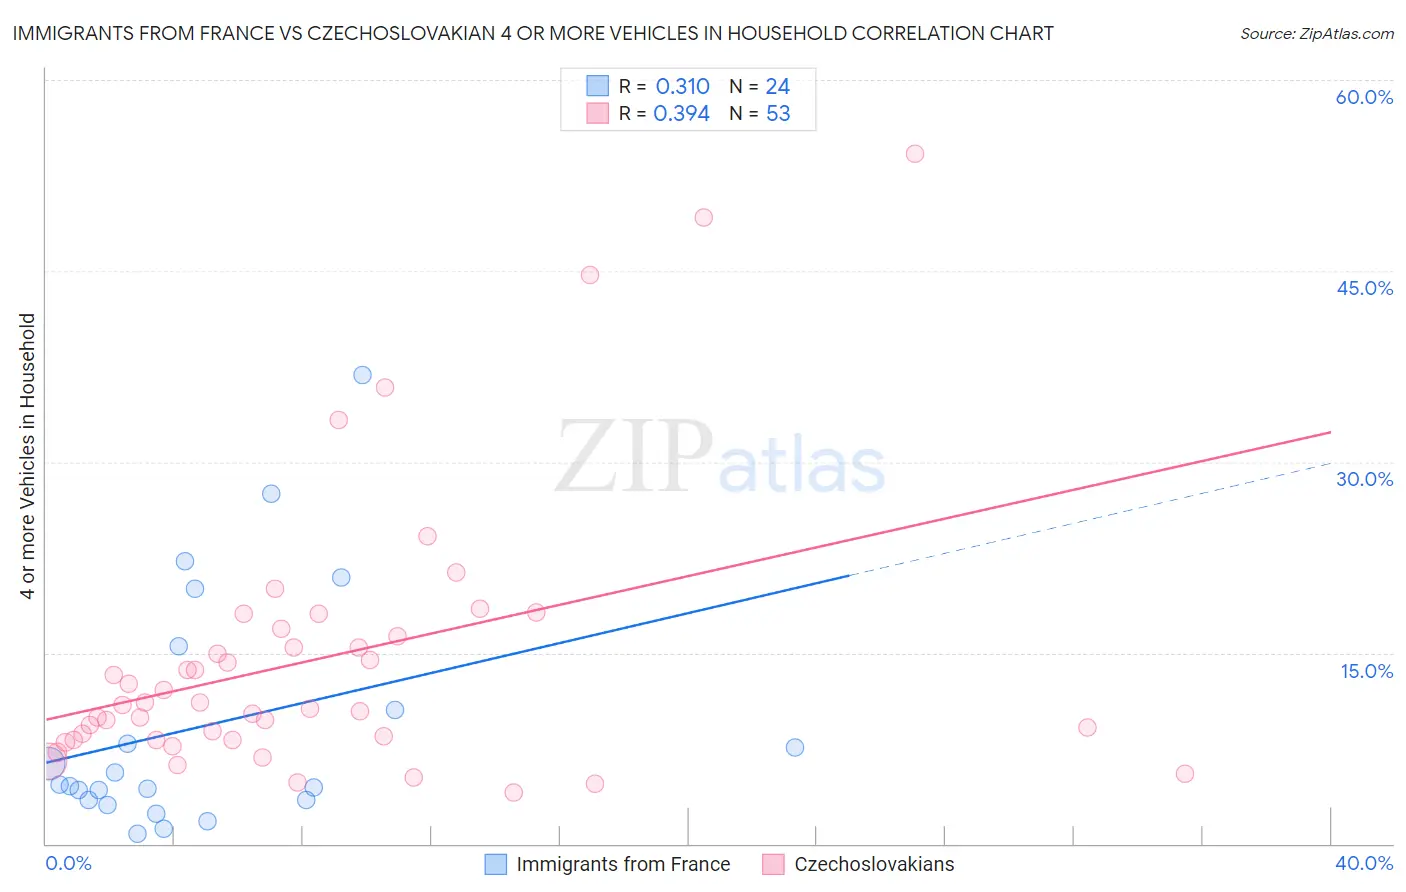
Immigrants from France vs Czechoslovakian 4 or more Vehicles in Household Correlation Chart
The statistical analysis conducted on geographies consisting of 286,406,976 people shows a mild positive correlation between the proportion of Immigrants from France and percentage of households with 4 or more vehicles available in the United States with a correlation coefficient (R) of 0.310 and weighted average of 5.6%. Similarly, the statistical analysis conducted on geographies consisting of 367,717,955 people shows a mild positive correlation between the proportion of Czechoslovakians and percentage of households with 4 or more vehicles available in the United States with a correlation coefficient (R) of 0.394 and weighted average of 7.1%, a difference of 26.2%.
4 or more Vehicles in Household Correlation Summary
| Measurement | Immigrants from France | Czechoslovakian |
| Minimum | 0.81% | 4.1% |
| Maximum | 36.8% | 54.2% |
| Range | 36.0% | 50.1% |
| Mean | 9.3% | 14.5% |
| Median | 4.6% | 10.9% |
| Interquartile 25% (IQ1) | 3.4% | 8.2% |
| Interquartile 75% (IQ3) | 13.0% | 16.6% |
| Interquartile Range (IQR) | 9.6% | 8.4% |
| Standard Deviation (Sample) | 9.5% | 10.7% |
| Standard Deviation (Population) | 9.3% | 10.6% |
Similar Demographics by 4 or more Vehicles in Household
Demographics Similar to Immigrants from France by 4 or more Vehicles in Household
In terms of 4 or more vehicles in household, the demographic groups most similar to Immigrants from France are Immigrants from Lithuania (5.6%, a difference of 0.030%), Immigrants from Northern Africa (5.6%, a difference of 0.17%), Uruguayan (5.6%, a difference of 0.18%), Immigrants from Turkey (5.7%, a difference of 0.25%), and Sudanese (5.6%, a difference of 0.27%).
| Demographics | Rating | Rank | 4 or more Vehicles in Household |
| Sub-Saharan Africans | 2.1 /100 | #252 | Tragic 5.7% |
| Immigrants | Cuba | 1.6 /100 | #253 | Tragic 5.7% |
| Immigrants | Panama | 1.5 /100 | #254 | Tragic 5.7% |
| Yup'ik | 1.5 /100 | #255 | Tragic 5.7% |
| Immigrants | Turkey | 1.5 /100 | #256 | Tragic 5.7% |
| Immigrants | Northern Africa | 1.4 /100 | #257 | Tragic 5.6% |
| Immigrants | Lithuania | 1.4 /100 | #258 | Tragic 5.6% |
| Immigrants | France | 1.3 /100 | #259 | Tragic 5.6% |
| Uruguayans | 1.3 /100 | #260 | Tragic 5.6% |
| Sudanese | 1.2 /100 | #261 | Tragic 5.6% |
| Bermudans | 1.2 /100 | #262 | Tragic 5.6% |
| Immigrants | Saudi Arabia | 1.1 /100 | #263 | Tragic 5.6% |
| Immigrants | Africa | 1.0 /100 | #264 | Tragic 5.6% |
| South Americans | 0.9 /100 | #265 | Tragic 5.6% |
| Immigrants | Nepal | 0.9 /100 | #266 | Tragic 5.6% |
Demographics Similar to Czechoslovakians by 4 or more Vehicles in Household
In terms of 4 or more vehicles in household, the demographic groups most similar to Czechoslovakians are Central American (7.1%, a difference of 0.010%), Dutch West Indian (7.1%, a difference of 0.21%), Immigrants from Afghanistan (7.1%, a difference of 0.22%), Celtic (7.1%, a difference of 0.37%), and Immigrants from Latin America (7.1%, a difference of 0.39%).
| Demographics | Rating | Rank | 4 or more Vehicles in Household |
| Immigrants | Nonimmigrants | 99.6 /100 | #88 | Exceptional 7.2% |
| British | 99.6 /100 | #89 | Exceptional 7.2% |
| Creek | 99.6 /100 | #90 | Exceptional 7.2% |
| Assyrians/Chaldeans/Syriacs | 99.4 /100 | #91 | Exceptional 7.2% |
| Immigrants | Latin America | 99.4 /100 | #92 | Exceptional 7.1% |
| Immigrants | Afghanistan | 99.3 /100 | #93 | Exceptional 7.1% |
| Dutch West Indians | 99.3 /100 | #94 | Exceptional 7.1% |
| Czechoslovakians | 99.3 /100 | #95 | Exceptional 7.1% |
| Central Americans | 99.3 /100 | #96 | Exceptional 7.1% |
| Celtics | 99.1 /100 | #97 | Exceptional 7.1% |
| Irish | 99.0 /100 | #98 | Exceptional 7.1% |
| Seminole | 98.8 /100 | #99 | Exceptional 7.0% |
| Taiwanese | 98.7 /100 | #100 | Exceptional 7.0% |
| Pakistanis | 98.7 /100 | #101 | Exceptional 7.0% |
| Asians | 98.6 /100 | #102 | Exceptional 7.0% |