Immigrants from Ghana vs Immigrants from Colombia 4 or more Vehicles in Household
COMPARE
Immigrants from Ghana
Immigrants from Colombia
4 or more Vehicles in Household
4 or more Vehicles in Household Comparison
Immigrants from Ghana
Immigrants from Colombia
5.2%
4 OR MORE VEHICLES IN HOUSEHOLD
0.1/ 100
METRIC RATING
299th/ 347
METRIC RANK
5.4%
4 OR MORE VEHICLES IN HOUSEHOLD
0.2/ 100
METRIC RATING
286th/ 347
METRIC RANK
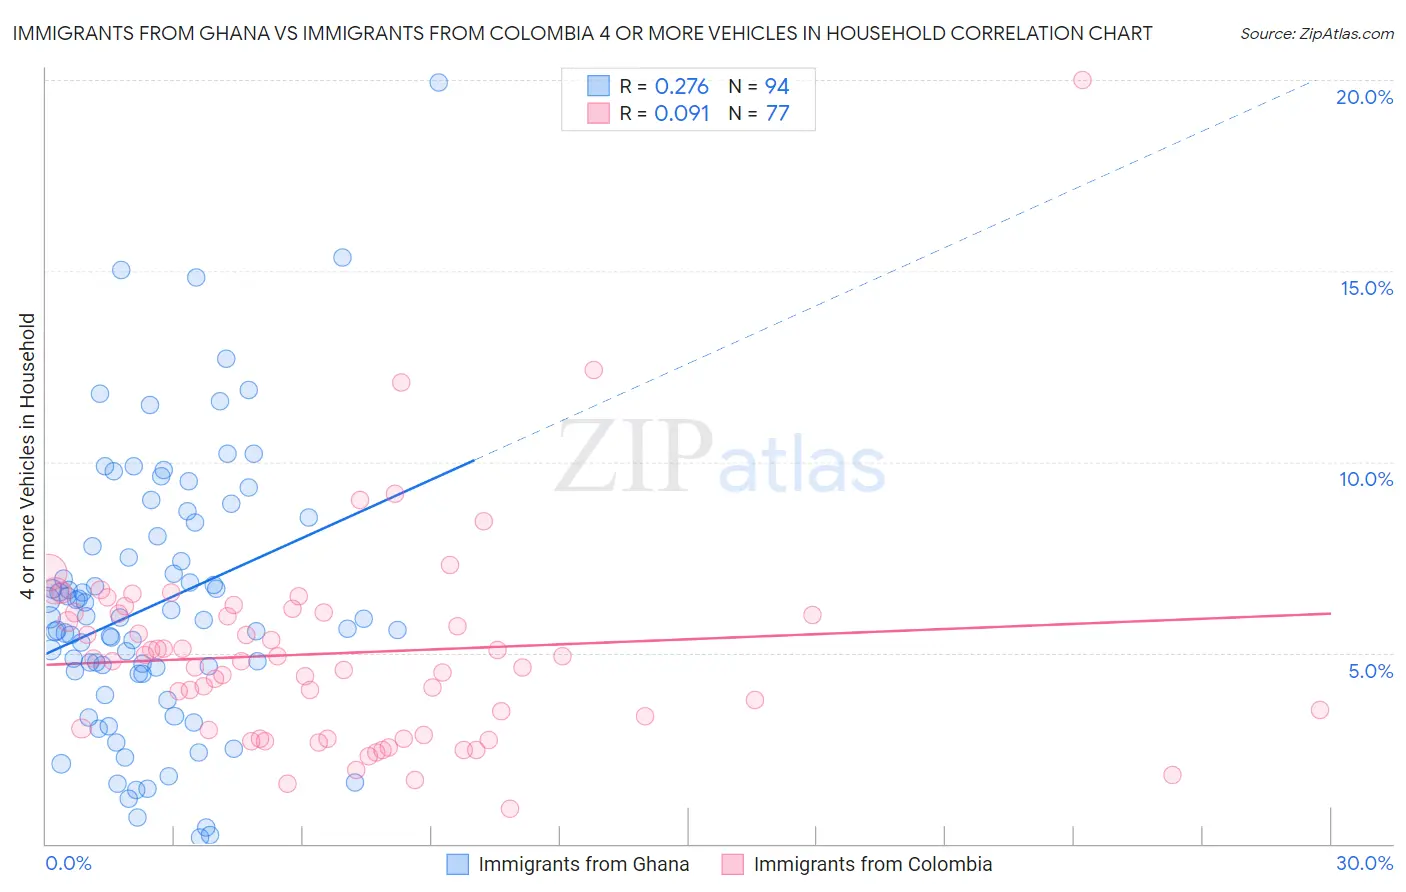
Immigrants from Ghana vs Immigrants from Colombia 4 or more Vehicles in Household Correlation Chart
The statistical analysis conducted on geographies consisting of 198,971,687 people shows a weak positive correlation between the proportion of Immigrants from Ghana and percentage of households with 4 or more vehicles available in the United States with a correlation coefficient (R) of 0.276 and weighted average of 5.2%. Similarly, the statistical analysis conducted on geographies consisting of 377,020,120 people shows a slight positive correlation between the proportion of Immigrants from Colombia and percentage of households with 4 or more vehicles available in the United States with a correlation coefficient (R) of 0.091 and weighted average of 5.4%, a difference of 3.5%.
4 or more Vehicles in Household Correlation Summary
| Measurement | Immigrants from Ghana | Immigrants from Colombia |
| Minimum | 0.17% | 0.92% |
| Maximum | 19.9% | 20.0% |
| Range | 19.8% | 19.1% |
| Mean | 6.3% | 5.0% |
| Median | 5.9% | 4.8% |
| Interquartile 25% (IQ1) | 4.4% | 2.9% |
| Interquartile 75% (IQ3) | 8.1% | 6.0% |
| Interquartile Range (IQR) | 3.6% | 3.1% |
| Standard Deviation (Sample) | 3.6% | 2.8% |
| Standard Deviation (Population) | 3.5% | 2.7% |
Demographics Similar to Immigrants from Ghana and Immigrants from Colombia by 4 or more Vehicles in Household
In terms of 4 or more vehicles in household, the demographic groups most similar to Immigrants from Ghana are Immigrants from South America (5.2%, a difference of 0.46%), Immigrants from Venezuela (5.2%, a difference of 0.79%), Israeli (5.2%, a difference of 1.1%), Immigrants from Brazil (5.2%, a difference of 1.3%), and Ghanaian (5.2%, a difference of 1.4%). Similarly, the demographic groups most similar to Immigrants from Colombia are Immigrants from Liberia (5.4%, a difference of 0.040%), Immigrants from Croatia (5.4%, a difference of 0.10%), Venezuelan (5.3%, a difference of 0.28%), Brazilian (5.4%, a difference of 0.38%), and Immigrants from Bosnia and Herzegovina (5.3%, a difference of 0.42%).
| Demographics | Rating | Rank | 4 or more Vehicles in Household |
| Immigrants | Spain | 0.3 /100 | #282 | Tragic 5.4% |
| Immigrants | Ireland | 0.3 /100 | #283 | Tragic 5.4% |
| Brazilians | 0.3 /100 | #284 | Tragic 5.4% |
| Immigrants | Liberia | 0.2 /100 | #285 | Tragic 5.4% |
| Immigrants | Colombia | 0.2 /100 | #286 | Tragic 5.4% |
| Immigrants | Croatia | 0.2 /100 | #287 | Tragic 5.4% |
| Venezuelans | 0.2 /100 | #288 | Tragic 5.3% |
| Immigrants | Bosnia and Herzegovina | 0.2 /100 | #289 | Tragic 5.3% |
| Immigrants | Russia | 0.2 /100 | #290 | Tragic 5.3% |
| Immigrants | Bahamas | 0.1 /100 | #291 | Tragic 5.3% |
| Liberians | 0.1 /100 | #292 | Tragic 5.3% |
| Immigrants | Congo | 0.1 /100 | #293 | Tragic 5.2% |
| Ghanaians | 0.1 /100 | #294 | Tragic 5.2% |
| Immigrants | Brazil | 0.1 /100 | #295 | Tragic 5.2% |
| Israelis | 0.1 /100 | #296 | Tragic 5.2% |
| Immigrants | Venezuela | 0.1 /100 | #297 | Tragic 5.2% |
| Immigrants | South America | 0.1 /100 | #298 | Tragic 5.2% |
| Immigrants | Ghana | 0.1 /100 | #299 | Tragic 5.2% |
| Immigrants | Morocco | 0.0 /100 | #300 | Tragic 5.1% |
| Immigrants | Zaire | 0.0 /100 | #301 | Tragic 5.1% |
| Bahamians | 0.0 /100 | #302 | Tragic 5.1% |