Immigrants from Ethiopia vs Seminole 2 or more Vehicles in Household
COMPARE
Immigrants from Ethiopia
Seminole
2 or more Vehicles in Household
2 or more Vehicles in Household Comparison
Immigrants from Ethiopia
Seminole
53.0%
2 OR MORE VEHICLES IN HOUSEHOLD
1.5/ 100
METRIC RATING
245th/ 347
METRIC RANK
56.2%
2 OR MORE VEHICLES IN HOUSEHOLD
81.7/ 100
METRIC RATING
143rd/ 347
METRIC RANK
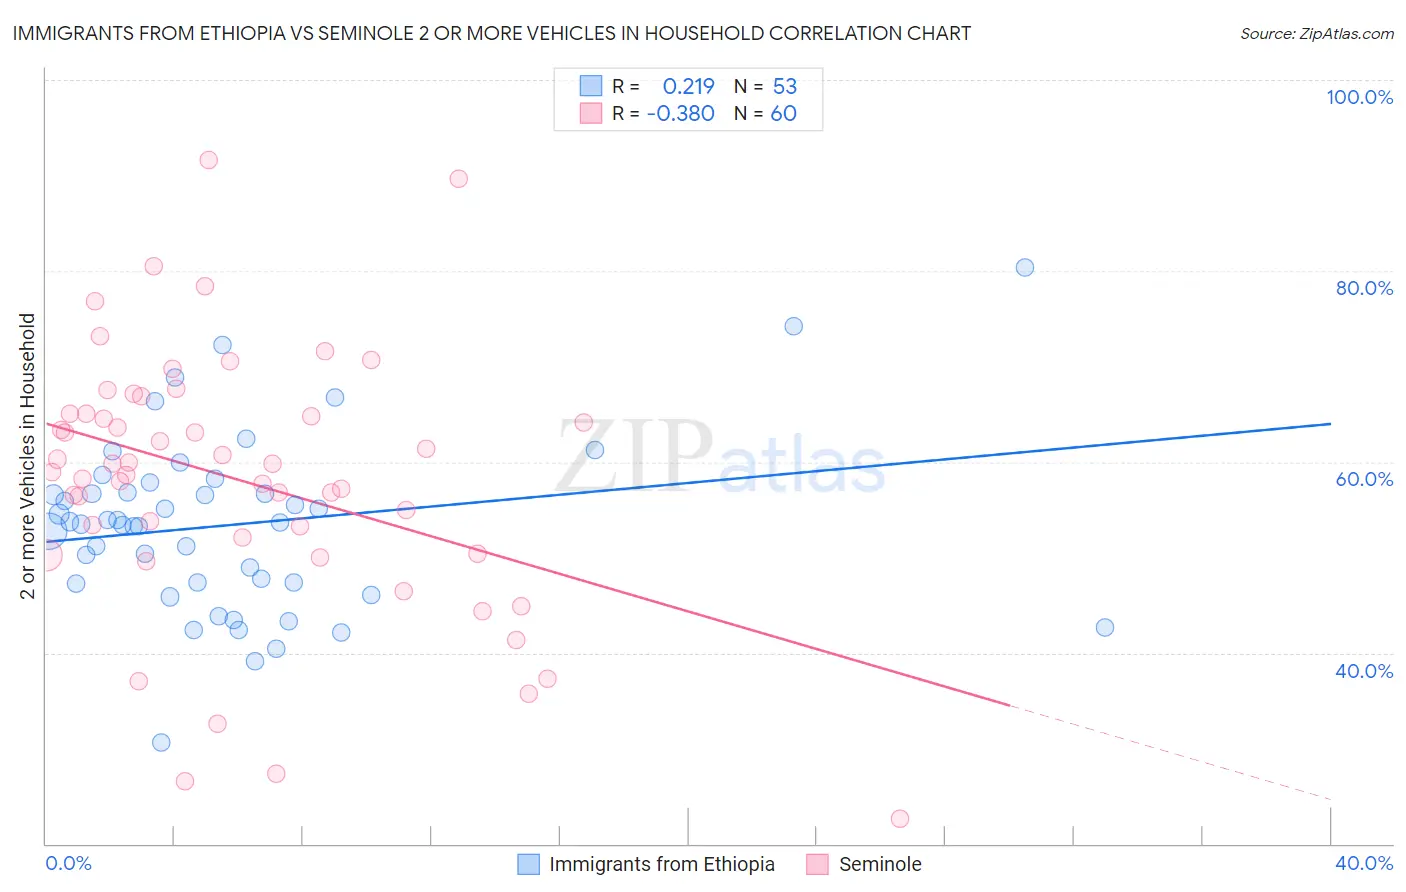
Immigrants from Ethiopia vs Seminole 2 or more Vehicles in Household Correlation Chart
The statistical analysis conducted on geographies consisting of 211,485,366 people shows a weak positive correlation between the proportion of Immigrants from Ethiopia and percentage of households with 2 or more vehicles available in the United States with a correlation coefficient (R) of 0.219 and weighted average of 53.0%. Similarly, the statistical analysis conducted on geographies consisting of 118,307,027 people shows a mild negative correlation between the proportion of Seminole and percentage of households with 2 or more vehicles available in the United States with a correlation coefficient (R) of -0.380 and weighted average of 56.2%, a difference of 5.9%.
2 or more Vehicles in Household Correlation Summary
| Measurement | Immigrants from Ethiopia | Seminole |
| Minimum | 30.6% | 22.6% |
| Maximum | 80.4% | 91.7% |
| Range | 49.7% | 69.1% |
| Mean | 53.4% | 58.0% |
| Median | 53.7% | 59.3% |
| Interquartile 25% (IQ1) | 47.3% | 51.3% |
| Interquartile 75% (IQ3) | 57.3% | 65.0% |
| Interquartile Range (IQR) | 10.0% | 13.7% |
| Standard Deviation (Sample) | 9.3% | 13.9% |
| Standard Deviation (Population) | 9.2% | 13.8% |
Similar Demographics by 2 or more Vehicles in Household
Demographics Similar to Immigrants from Ethiopia by 2 or more Vehicles in Household
In terms of 2 or more vehicles in household, the demographic groups most similar to Immigrants from Ethiopia are Indian (Asian) (53.1%, a difference of 0.12%), Ethiopian (53.1%, a difference of 0.16%), Immigrants from Nigeria (52.9%, a difference of 0.20%), Sierra Leonean (52.9%, a difference of 0.22%), and Immigrants from Eastern Asia (53.2%, a difference of 0.35%).
| Demographics | Rating | Rank | 2 or more Vehicles in Household |
| Immigrants | Armenia | 2.3 /100 | #238 | Tragic 53.3% |
| Cambodians | 2.3 /100 | #239 | Tragic 53.3% |
| Immigrants | Europe | 2.1 /100 | #240 | Tragic 53.2% |
| Immigrants | Sierra Leone | 2.1 /100 | #241 | Tragic 53.2% |
| Immigrants | Eastern Asia | 2.1 /100 | #242 | Tragic 53.2% |
| Ethiopians | 1.7 /100 | #243 | Tragic 53.1% |
| Indians (Asian) | 1.7 /100 | #244 | Tragic 53.1% |
| Immigrants | Ethiopia | 1.5 /100 | #245 | Tragic 53.0% |
| Immigrants | Nigeria | 1.2 /100 | #246 | Tragic 52.9% |
| Sierra Leoneans | 1.2 /100 | #247 | Tragic 52.9% |
| Colombians | 1.1 /100 | #248 | Tragic 52.9% |
| Immigrants | Brazil | 1.0 /100 | #249 | Tragic 52.8% |
| Mongolians | 1.0 /100 | #250 | Tragic 52.8% |
| Immigrants | Sudan | 1.0 /100 | #251 | Tragic 52.8% |
| Immigrants | Portugal | 1.0 /100 | #252 | Tragic 52.8% |
Demographics Similar to Seminole by 2 or more Vehicles in Household
In terms of 2 or more vehicles in household, the demographic groups most similar to Seminole are Immigrants from Syria (56.2%, a difference of 0.020%), Syrian (56.2%, a difference of 0.030%), Venezuelan (56.1%, a difference of 0.070%), South African (56.2%, a difference of 0.090%), and Serbian (56.1%, a difference of 0.090%).
| Demographics | Rating | Rank | 2 or more Vehicles in Household |
| Immigrants | Asia | 86.0 /100 | #136 | Excellent 56.3% |
| Cubans | 84.8 /100 | #137 | Excellent 56.3% |
| Salvadorans | 84.7 /100 | #138 | Excellent 56.3% |
| Armenians | 84.3 /100 | #139 | Excellent 56.3% |
| Latvians | 83.6 /100 | #140 | Excellent 56.2% |
| Immigrants | Cambodia | 83.6 /100 | #141 | Excellent 56.2% |
| South Africans | 83.1 /100 | #142 | Excellent 56.2% |
| Seminole | 81.7 /100 | #143 | Excellent 56.2% |
| Immigrants | Syria | 81.4 /100 | #144 | Excellent 56.2% |
| Syrians | 81.2 /100 | #145 | Excellent 56.2% |
| Venezuelans | 80.7 /100 | #146 | Excellent 56.1% |
| Serbians | 80.3 /100 | #147 | Excellent 56.1% |
| Immigrants | Moldova | 80.2 /100 | #148 | Excellent 56.1% |
| Chileans | 80.2 /100 | #149 | Excellent 56.1% |
| Nicaraguans | 79.9 /100 | #150 | Good 56.1% |